
Figures & data
Table 1. The logic behind the procedure used.
Figure 1. Overview of the study design. The four conditions differed in amount of support received while completing the near and far transfer items of the posttest.
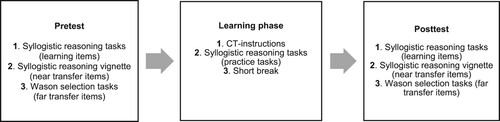
Figure 2. Violin plots with the full distribution per condition and test moment (i.e. pretest and posttest) on performance on learning items (maximum total score of 12) in Experiment 1.
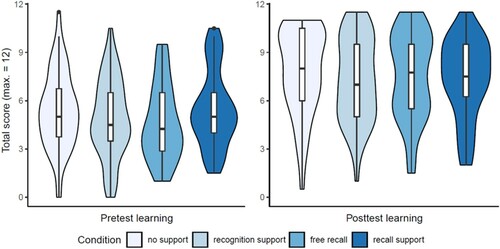
Figure 3. Violin plots with the full distribution per condition and test moment (i.e. pretest and posttest) on performance on near transfer items (maximum total score of 7.5) in Experiment 1.
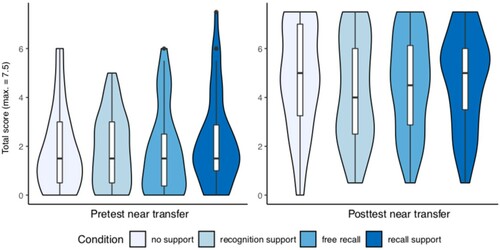
Figure 4. Violin plots with the full distribution per condition and test moment (i.e. pretest and posttest) on performance on far transfer items (maximum total score of 9) in Experiment 1.
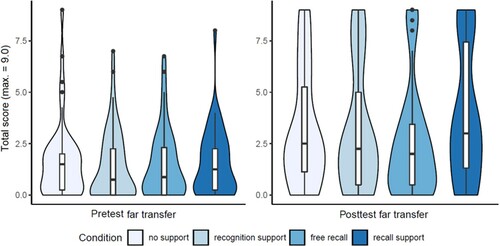
Table 2. Experiment 1: mean (SD) of test performance (number of items correct) on learning (0–12), near transfer (0–7.5), and far transfer items (0–9) and mean (SD) of time-on-task (in seconds) on learning, near transfer, and far transfer items per condition.
Table 3. Experiment 1: Pearson correlation matrix (p-value) for the learning and transfer measures.
Figure 5. Graphical representation of the relationship between retrieved information during free recall and posttest near transfer performance in Experiment 1. Two measures of retrieved information were used: nothing written down was either coded as no recall or as missing value.
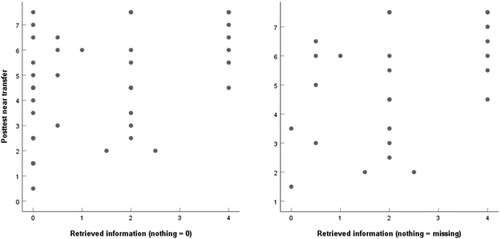
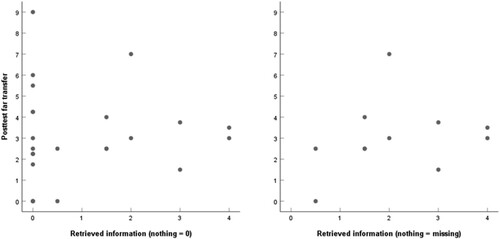
Figure 6. Graphical representation of the relationship between retrieved information during free recall and posttest far transfer performance in Experiment 1. Two measures of retrieved information were used: nothing written down was either coded as no recall or as missing value.
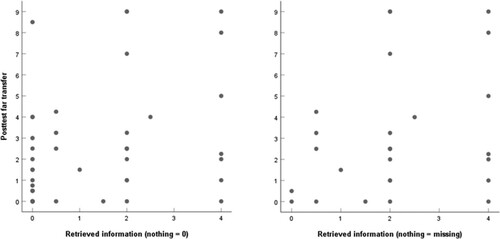
Figure 7. Violin plots with the full distribution per condition and test moment (i.e. pretest and posttest) on performance on learning items (maximum total score of 12) in Experiment 2.
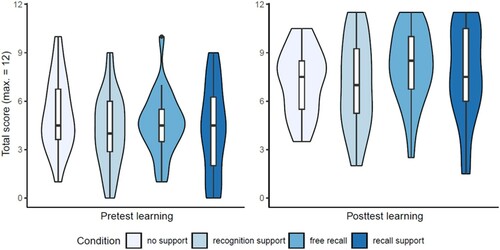
Figure 8. Violin plots with the full distribution per condition and test moment (i.e. pretest and posttest) on performance on near transfer items (maximum total score of 7.5) in Experiment 2.
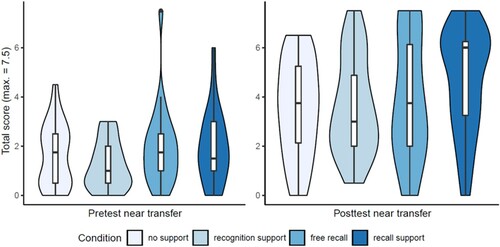
Figure 9. Violin plots with the full distribution per condition and test moment (i.e. pretest and posttest) on performance on far transfer items (maximum total score of 9) in Experiment 2.
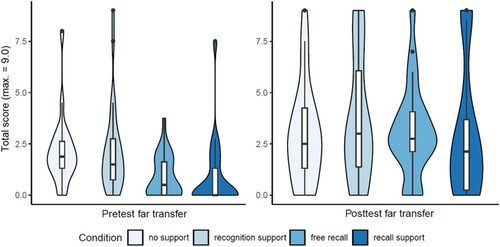
Table 4. Experiment 2: mean (SD) of test performance (number of items correct) on learning (0–12), near transfer (0–7.5), and far transfer items (0–9) and mean (SD) of time-on-task (in seconds) on learning, near transfer, and far transfer items per condition.
Table 5. Experiment 2: Pearson correlation matrix (p-value) for the learning and transfer measures.
Figure 10. Graphical representation of the relationship between retrieved information during free recall and posttest near transfer performance in Experiment 2. Two measures of retrieved information were used: nothing written down was either coded as no recall or as missing value.
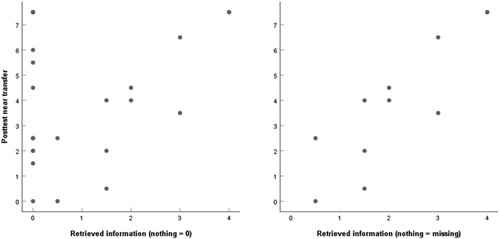
Figure 11. Graphical representation of the relationship between retrieved information during free recall and posttest far transfer performance in Experiment 2. Two measures of retrieved information were used: nothing written down was either coded as no recall or as missing value.
Data availability statement
The datasets and script files are stored on an Open Science Framework (OSF) page for this project, see osf.io/ybt5g.