
Figures & data
Figure 1. Example of SCS1-Short question. Note. This figure presents question 5 of Version 1 of the SCS1-Short.
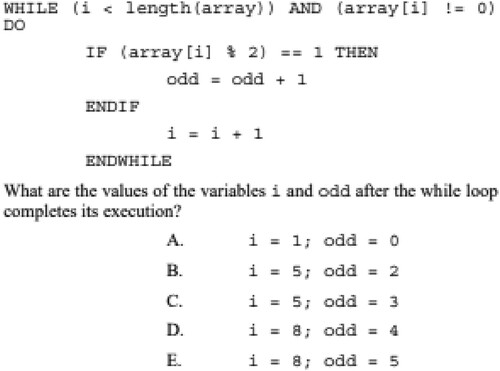
Figure 2. Example of course exam question. Note: This figure presents a question on the topic of “variables and conditions” from the course exam.
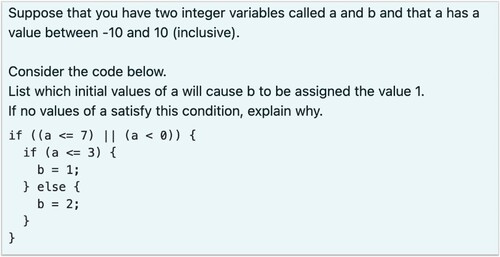
Figure 3. Example of a learning item on the vocabulary learning test. [To view this figure in color, please see the online version of this journal.] Note: This figure shows one of 20 learning items on the vocabulary learning test.
![Figure 3. Example of a learning item on the vocabulary learning test. [To view this figure in color, please see the online version of this journal.] Note: This figure shows one of 20 learning items on the vocabulary learning test.](/cms/asset/469816f6-a37e-47fd-be18-abde95897f1a/pecp_a_2166054_f0003_oc.jpg)
Figure 4. Example of a learning item on the grammar learning test. [To view this figure in color, please see the online version of this journal.] Note: This example from the grammar learning test shows the training sentence on the left that described the image on the right.
![Figure 4. Example of a learning item on the grammar learning test. [To view this figure in color, please see the online version of this journal.] Note: This example from the grammar learning test shows the training sentence on the left that described the image on the right.](/cms/asset/7e242634-dca5-4049-8688-9f4bb6980fef/pecp_a_2166054_f0004_oc.jpg)
Figure 5. Partial slopes for each standardised cognitive skill predicting scores on the SCS1-short and course grades. [To view this figure in color, please see the online version of this journal.] Note: Top row: Partial slopes for each standardised cognitive skill predicting raw scores on the SCS1-Short. Bottom row: Partial slopes for each standardised cognitive skill predicting raw course grades. For the models relating to each plot the other predictors and control variables are held constant. The shaded area represents a pointwise confidence band based on standard errors. The lines on the horizontal axes show the exact scores on the cognitive tests for each individual participant.
![Figure 5. Partial slopes for each standardised cognitive skill predicting scores on the SCS1-short and course grades. [To view this figure in color, please see the online version of this journal.] Note: Top row: Partial slopes for each standardised cognitive skill predicting raw scores on the SCS1-Short. Bottom row: Partial slopes for each standardised cognitive skill predicting raw course grades. For the models relating to each plot the other predictors and control variables are held constant. The shaded area represents a pointwise confidence band based on standard errors. The lines on the horizontal axes show the exact scores on the cognitive tests for each individual participant.](/cms/asset/de4d45f4-c079-4aa7-9caa-f12172836b68/pecp_a_2166054_f0005_oc.jpg)
Table 1. Predictors of score on the SCS1-short programming test and course grade at the end of the semester.
Table 2. Correlations between cognitive tests.
Figure 6. Fitted structural model representing the relationship between language and algorithmic/mathematical thinking and generalised programming skill as measured by the SCS1-short. [To view this figure in color, please see the online version of this journal.] Note: Blue arrows and * indicate significant estimates at p < .05. Red arrows indicate p > .05. Estimates are written along their corresponding model lines.
![Figure 6. Fitted structural model representing the relationship between language and algorithmic/mathematical thinking and generalised programming skill as measured by the SCS1-short. [To view this figure in color, please see the online version of this journal.] Note: Blue arrows and * indicate significant estimates at p < .05. Red arrows indicate p > .05. Estimates are written along their corresponding model lines.](/cms/asset/d3b2a4e5-d88c-48aa-b437-660a606b8f6b/pecp_a_2166054_f0006_oc.jpg)
Figure 7. Fitted structural model representing the relationship between language and algorithmic/mathematical thinking and course-related programming skill as measured by the course grades. [To view this figure in color, please see the online version of this journal.]
Note: Blue arrows and * indicate significant estimates at p < .05. Red arrows indicate p > .05. Estimates are written along their corresponding model lines.
![Figure 7. Fitted structural model representing the relationship between language and algorithmic/mathematical thinking and course-related programming skill as measured by the course grades. [To view this figure in color, please see the online version of this journal.]Note: Blue arrows and * indicate significant estimates at p < .05. Red arrows indicate p > .05. Estimates are written along their corresponding model lines.](/cms/asset/6c41d23f-168c-40c0-8210-d974b9fc13e9/pecp_a_2166054_f0007_oc.jpg)
Data availability statement
The data that support the findings of this study are openly available in the Cognition of Coding project in OSF storage at https://osf.io/8nax4/?view_only=eb0341df544b435792e436451929e2cd.