
Figures & data
Table 1. Participants listed with their pseudonyms, chronological age, and Vineland age equivalents for daily living skills (personal Sub-domain) (DLSP), receptive communication (RC), and expressive communication (EC).
Figure 1. The diagram shows the desk at which the participants sat during the sessions with (a) four boxes containing the objects for the activities, which were arranged on a sliding plane at the right side of the desk, (b) a bag in which the participants were to place the objects of a kit, (c) the carton in which the participants were to deposit each completed kit as well as each box once the objects available in it had been used, and (d) a Big Candy Corn sensor for detecting the participants’ responses.
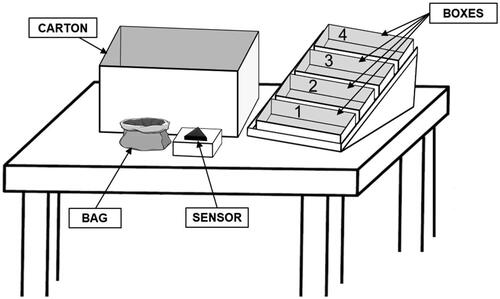
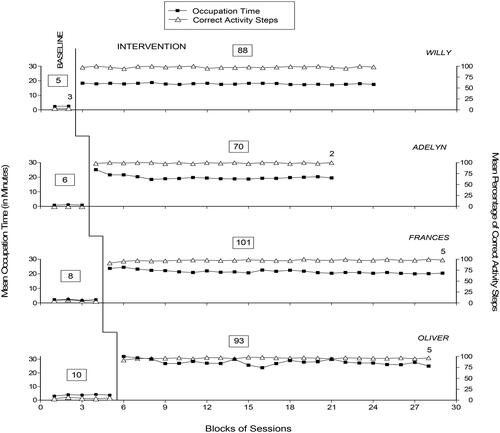
Figure 2. The black squares and empty triangles represent the mean occupation time (in minutes) and the mean percentage of correct activity steps per session over blocks of sessions, respectively. The blocks include two sessions during the baseline and four sessions during the intervention. Blocks with different numbers of sessions (i.e. at the end of the phases) are marked with a numeral indicating the sessions included. The numbers in the boxes indicate how many sessions the participants received during baseline and intervention.
Data availability
Data not available publicly.