Figures & data
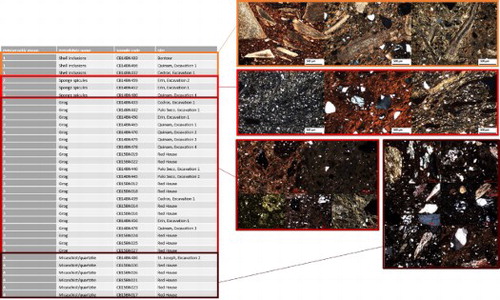
Figure 1. Situation of Trinidad in the wider region.
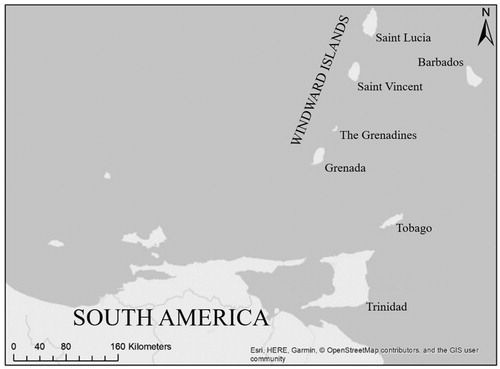
Figure 2. Trinidad surface geology with discussed sites and clay sampling locations.
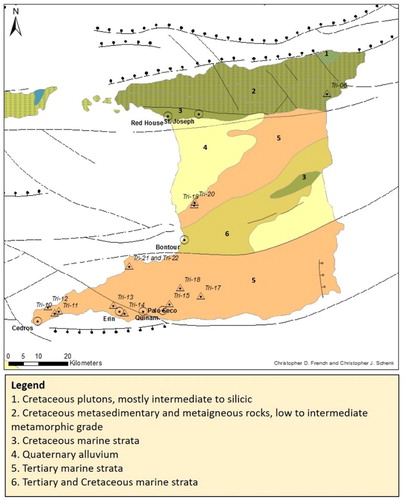
Figure 3. Summary pre-contact ceramic age chronological chart based on 14C dates. Adapted from Boomert Citation2000, 128.
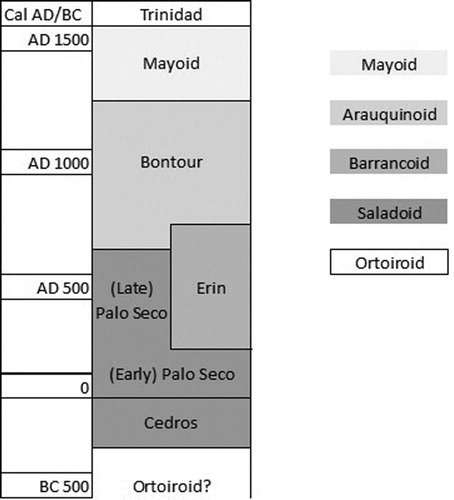
Table 1. Overview of the thin sections.
Table 2. Relative frequencies of inclusions and voids.
Figure 4. From left to right and top to bottom: CB14BN483, CB14BN466 and CB14BN432 under XP.
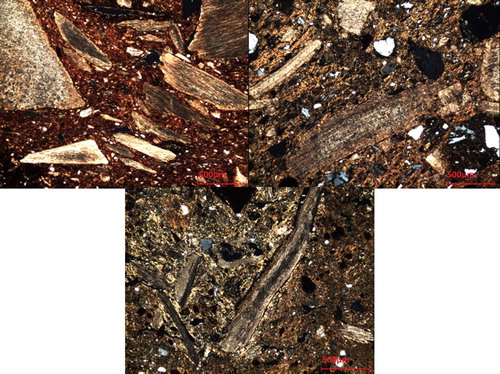
Figure 5. From left to right and top to bottom: CB14BN59, CB14BN480 and CB14BN452 under XP.
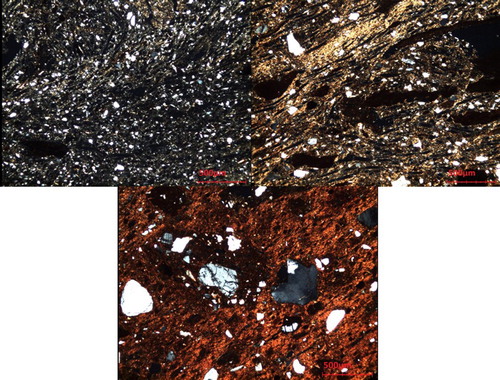
Figure 6. From left to right and top to bottom: CB15BN014, CB15BN016, CB15BN012, CB15BN024 and CB14BN439 in XP.
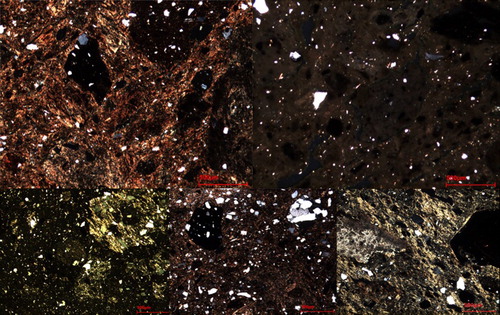
Table 3. Major oxides of ceramics and clays.
Figure 7. from left to right and top to bottom: CB14BN486, CB15BN020, CB15BN026, CB15BN021, CB15BN023 and CB15BN017 under XP.
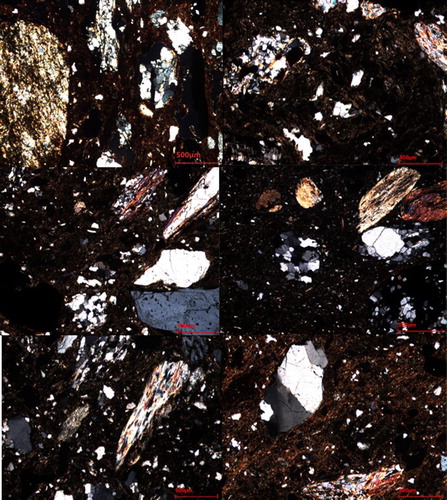
Figure 8. MgO/Al2O3 vs. K2O/Al2O3 scatterplot.
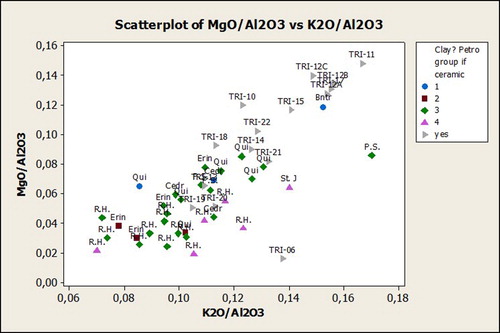
Figure 9. Na2O vs. MgO scatterplot.
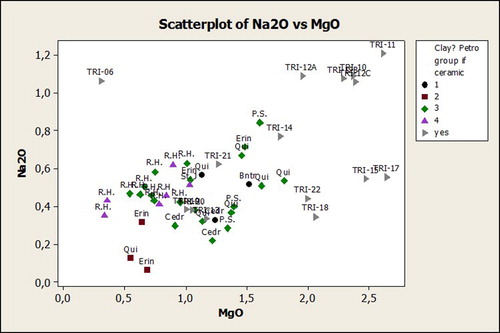
Figure 10. Cu vs. Zn scatterplot. Bulk of samples between 20–50 ppm for Cu and 90–250 ppm for Zn.
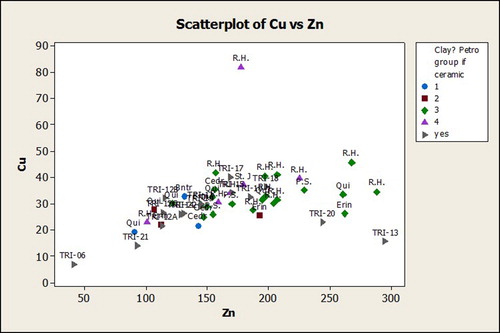
Figure 11. Cr vs. Ni scatterplot. Most samples between 50–160 ppm for Cr and 15–80 for Ni.
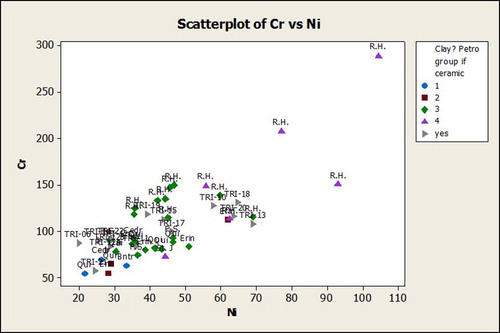
Figure 12. Zr vs. Ba scatterplot. Most samples between 100–270 ppm for Zr. For Ba, clays between 350–500 ppm and most ceramics 400–1000 ppm.
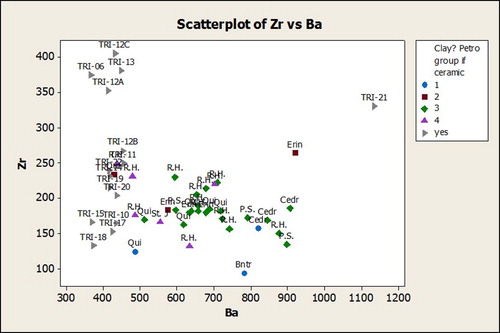
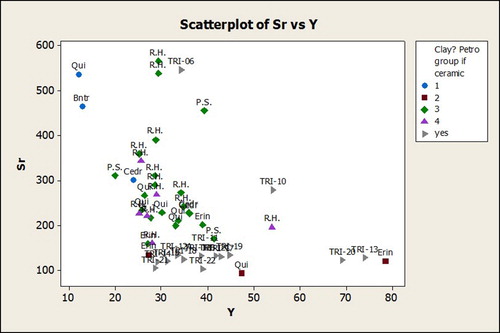
Figure 13. Sr vs. Y scatterplot. Most samples 90–400 ppm for Sr (some exceptions from groups 1 and 3). Most samples 20–50 ppm for Y with outliers from groups 1 and 4.