Figures & data
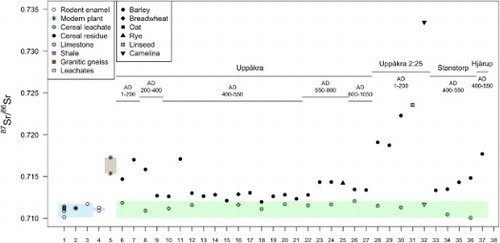
Figure 1. Location of sampled archaeological sites on a soil map.
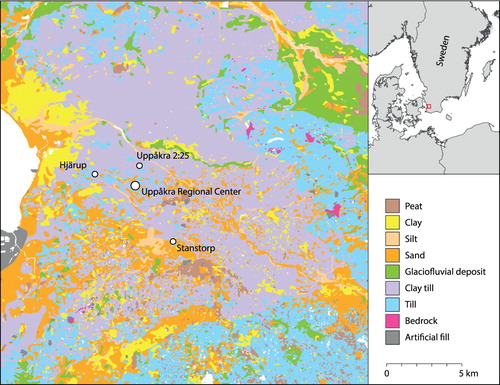
Table 1. Chronology of the Swedish Iron Age.
Figure 2. Bedrock map of Scania with sample locations of baseline Sr isotope ratios.
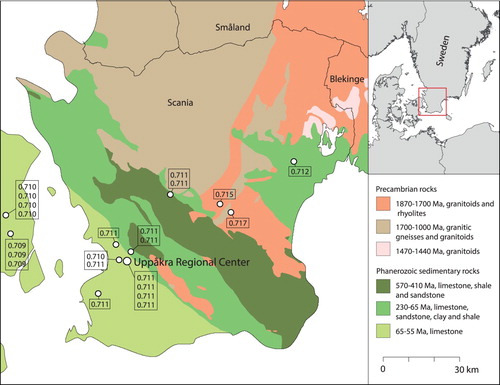
Table 2. Number of samples of plant and faunal remains selected for strontium isotope analysis from each archaeological site.
Table 3. 87Sr/86Sr values of archaeological cereal grains and seeds of oil plants (residues and leachates) from Uppåkra and its surrounding sites and the 87Sr/86Sr values of archaeological rodent tooth enamel and modern plant samples from different bedrock types in Scania.
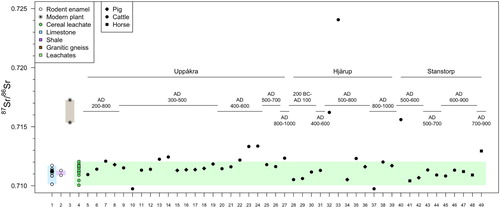
Table 4. 87Sr/86Sr values of archaeological faunal tooth enamel from Uppåkra and the nearby sites of Hjärup and Stanstorp and the 87Sr/86Sr values of archaeological rodent tooth enamel and modern plant samples from various bedrock types in Scania.
Figure 3. 87Sr/86Sr values of archaeological cereal grains (residues and leachates) from Uppåkra and its surrounding sites compared to the 87Sr/86Sr values of archaeological rodent tooth enamel and modern plant samples from various bedrock types in Scania. Shading represents the range in 87Sr/86Sr values of each group.
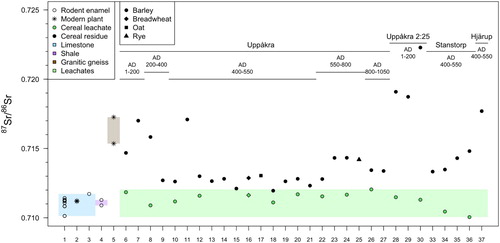
Figure 4. Normal probability plots (Q–Q plot), comparing the 87Sr/86Sr values of: (A) archaeological cereal grain leachates; (B) archaeological cereal grain residues; (C) livestock (pig, cattle and horse) tooth enamel samples to their expected normal curves.
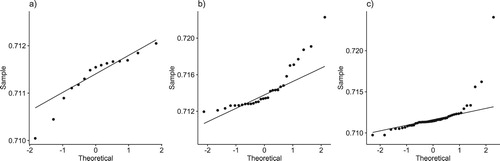
Figure 5. 87Sr/86Sr values of archaeological faunal tooth enamel from Uppåkra and the nearby sites of Hjärup and Stanstorp, compared to the 87Sr/86Sr values of archaeological rodent tooth enamel and modern plant samples from various bedrock types in Scania and archaeological cereal grain leachates from Uppåkra and surrounding sites. Shading represents the range in 87Sr/86Sr values of each group defining a local baseline.