Figures & data
Figure 1. Location map. The upper figure shows the site of Deir el-'Azar over a satellite map (Google). The lower picture is an aerial view, looking south.
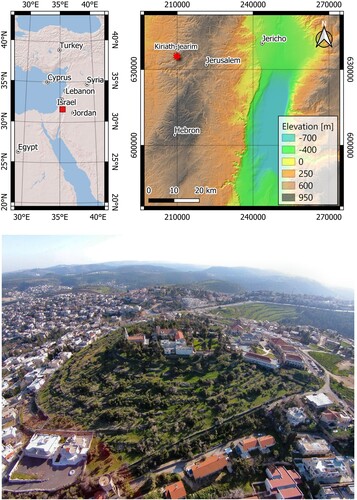
Figure 2. A. View of the site looking south, showing the flat nature of the summit. B. The massive terrace in the west, looking northeast (the cement wall was built in the 1980s). C. The massive terraces in the east, looking northwest. D. The massive retaining wal.
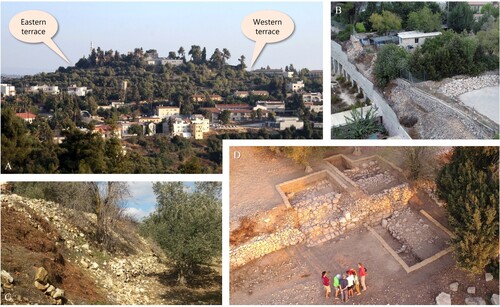
Figure 3. GPR scan traces (red lines) over the three sectors at Kiriath-Yearim (blue polygons).
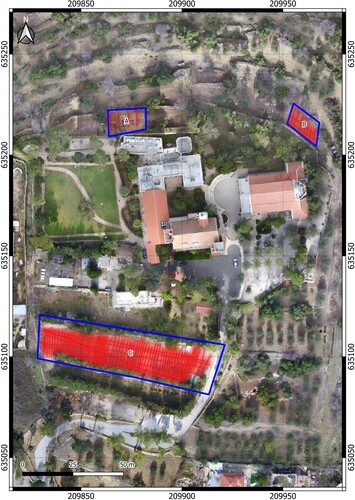
Figure 4. GPR processing scheme.
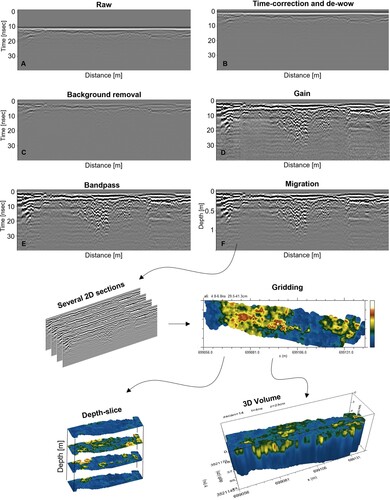
Figure 5. GPR survey in Sector A. The left-side photo was taken at the end of the excavation season. The right-side picture shows the scans after backfilling.
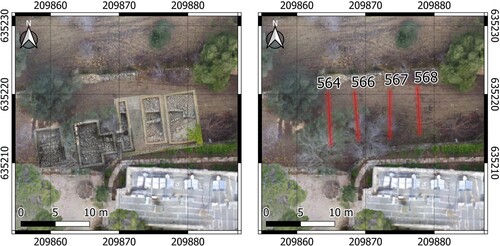
Figure 6. Representative depth slice results for Sector B (), where yellow-reddish color indicates anomalies. The lower picture shows the GPR scans in red over a depth slice at a depth of 32-43 cm.
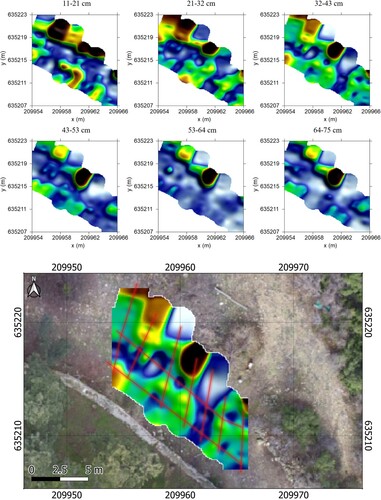
Figure 7. Representative depth slice results for Sector C (), where yellow-reddish color indicates anomalies. The depth slice representing 12 cm shows distinct high-amplitude anomalies, which may be produced from buried wall structures.
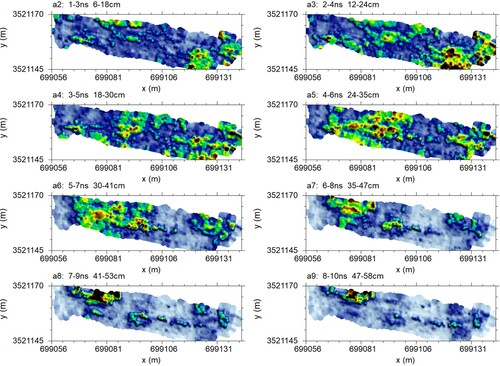
Figure 8. GPR scans at Sector A with the interpreted anomalies. In the lower part are the GPR scans (a permittivity of 16 has been used) with interpretation.
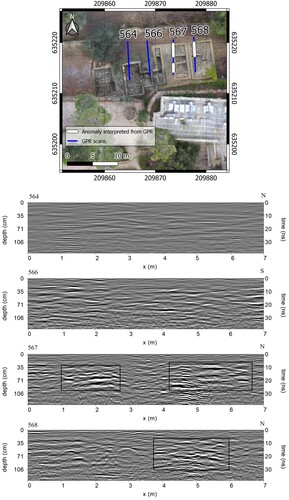
Figure 9. Depth-slice 30-41 cm in Sector C, which may indicate a massive buried stone wall. The black dashed polygon delimits the suspected area.
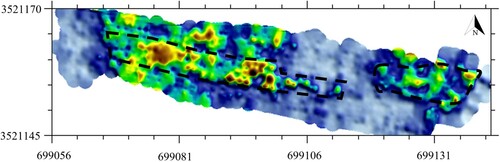
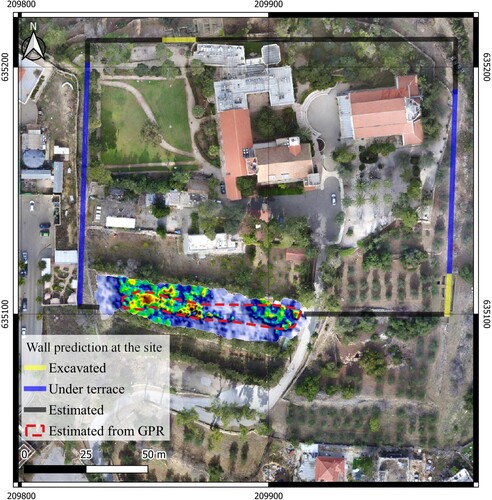
Figure 10. The outcome of the GPR scans (depth slice at a depth of ∼30-41 cm) combined with the evidence of the excavations.