
Figures & data
Figure 1. General Ashdod-Yam site location (created by Itamar Ben-Ezra).
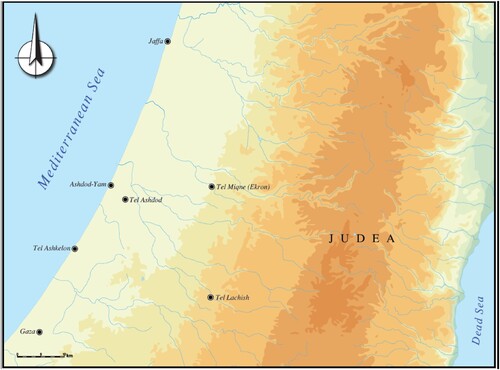
Figure 2. Aerial photograph of Ashdod-Yam, 1944 (courtesy Survey of Israel).
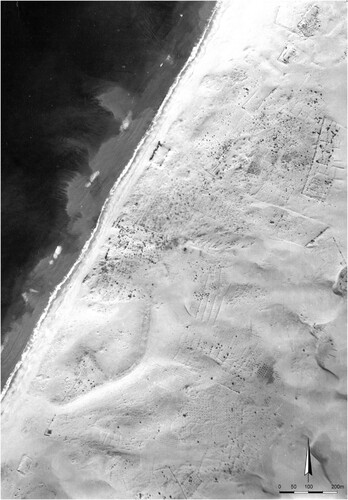
Figure 3. Close-up representation of Ashdod-Yam (Azotos Paralios) and Ashdod (Azotos Mesogaios) on a sixth century CE Madaba mosaic map section (after Alliata Citation1999: figs. on pp. 81, 83). The full original mosaic map measured ca. 21 × 7 m, containing more than two million tesserae.
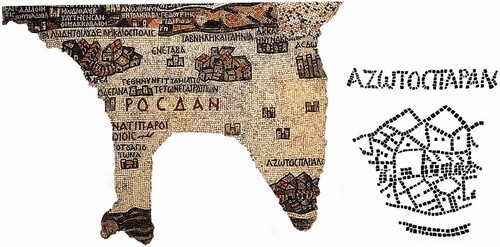
Figure 4. Geological map excerpt mapped at 1:50,000 (Sneh and Rosensaft Citation2004). Red star marks Ashdod-Yam.
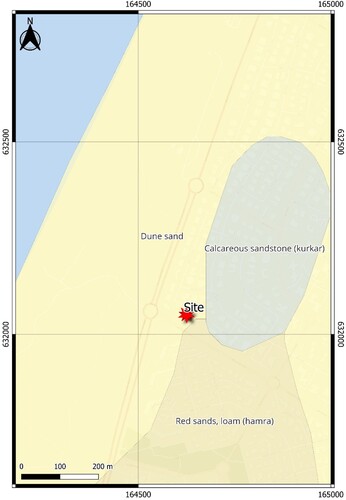
Figure 5. Left: Room 1 at pilot season end. Right: Partially-excavated inscription in Room 3 at pilot season end (created by Sasha Flit).
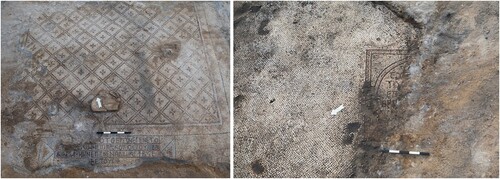
Figure 6. Exposed remains during the pilot season (created by Slava Pirsky).
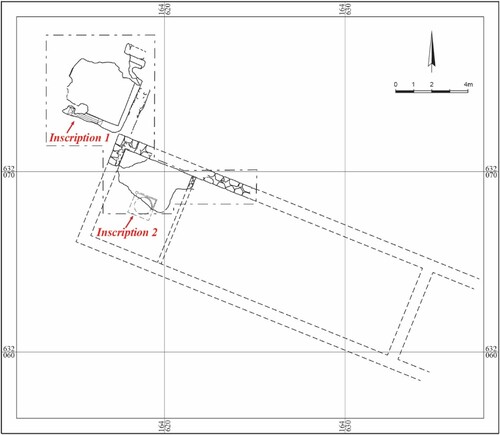
Figure 7. Slanted rectangle in center delimits ERS results (created by John Hunt and Slava Pirsky). Background – orthophoto.
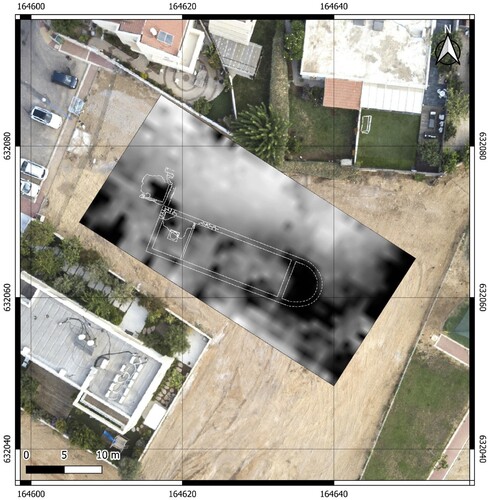
Figure 8. Post-season orthophoto, July/August 2019 (created by Slava Pirsky and Sergey Alon).
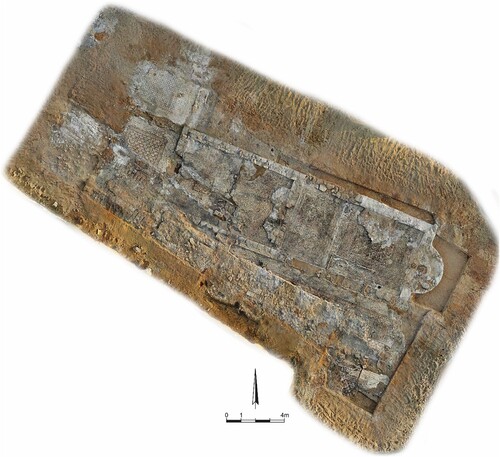
Figure 9. Church complex post-excavation with three tentatively suggested constructional phases: Phase 1 (blue); Phase 2 (red); Phase 3 (green) (created by Slava Pirsky).
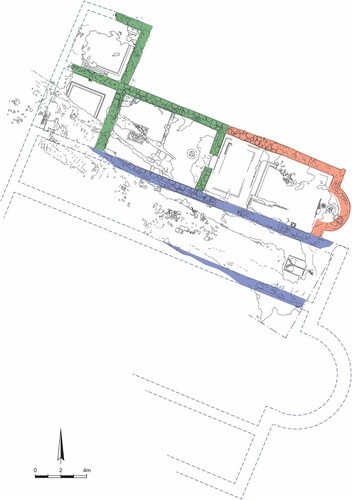
Figure 10. Post-season aerial photograph of the covered complex.
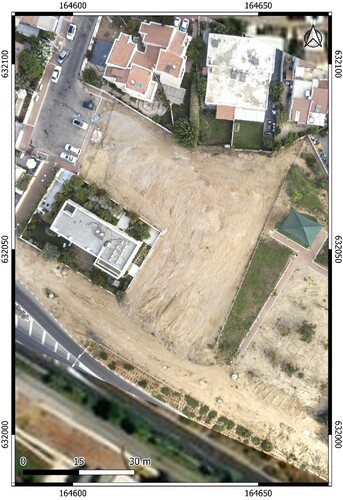
Figure 11. Excavation area (left) and GPR scan transects (right).
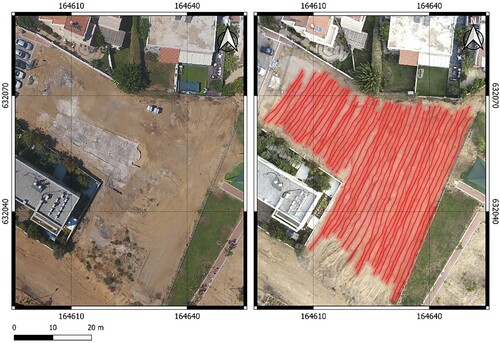
Figure 12. Schematic view of the GPR processing sequence (after Darvasi, Agnon, and Finkelstein Citation2022).
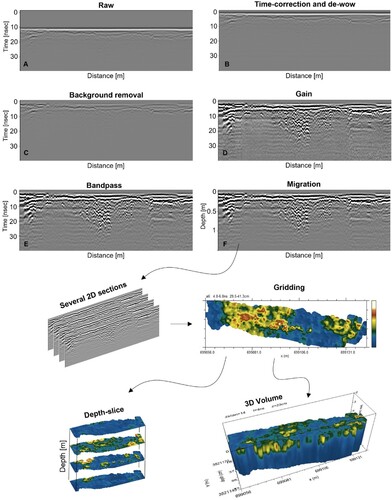
Figure 13. GPR depth slices. Yellow-red colors indicate anomalies.
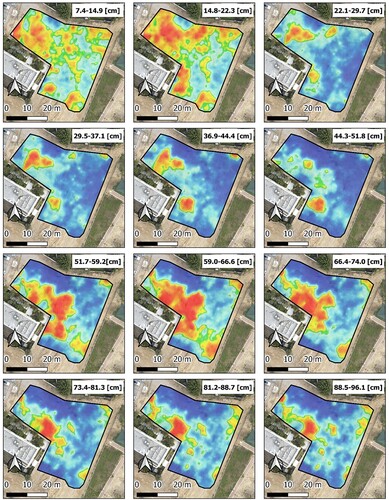
Figure 14. Orthophoto at July/August 2021 season end (created by Slava Pirsky and Sergey Alon).
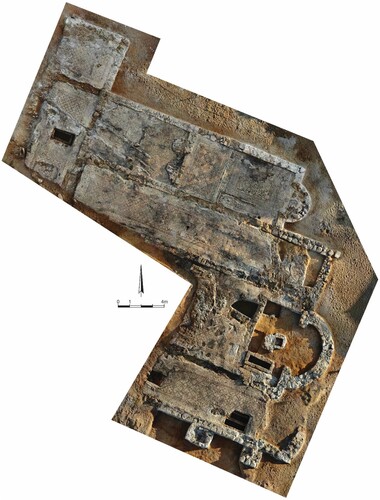
Figure 15. Final stratigraphic and architectural phases of the excavated complex (created by Slava Pirsky, Liora Bouzaglou, & Alexander Fantalkin).
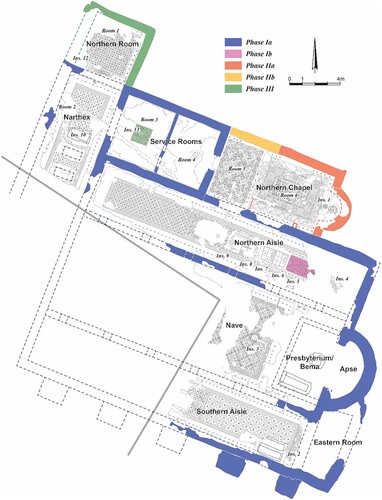
Figure 16. A semi-transparent map of the excavation orthophotos overlaid onto one GPE depth slice map. A. A post-2019 season orthophoto. B. A GPR depth slice (0.6 m) overlaying a post-2019 season orthophoto. C. A post-2021 season orthophoto. D. A GPR depth slice (0.6 m) overlaying a post-2021 season orthophoto, demonstrating the strong correlation between the GPR images and the actual excavation findings.
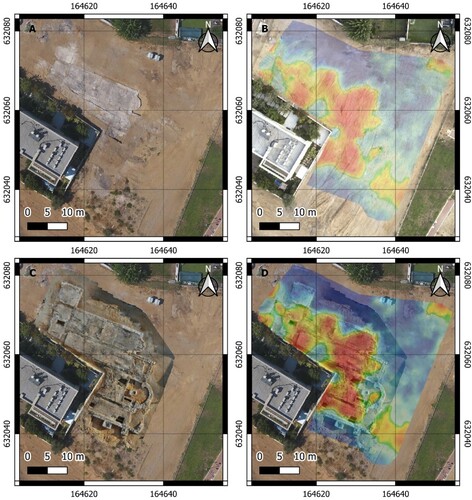
Figure 17. Ground-truthing and deciphering GPR profiles (a): An interpreted GPR profile with the excavated area following data acquisition. Yellow symbols and Photo 1 indicate the mosaics. Light blue symbols and Photo 2 indicate collapse of roof material. Green symbols and Photo 3 indicate a robbed wall. Red symbols and Photo 4 indicate the remaining foundations of stone walls.
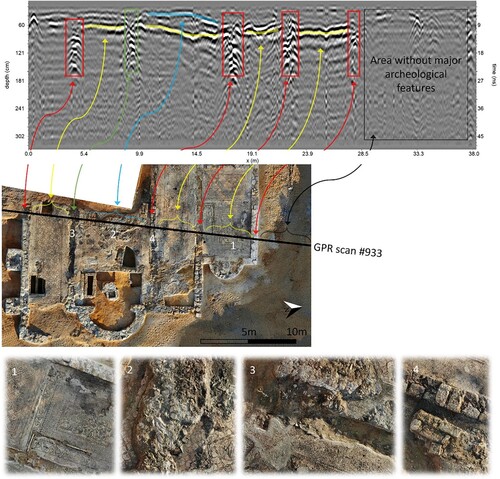
Figure 18. Ground-truthing and deciphering GPR profiles (b): An interpreted GPR profile with the excavated area following data acquisition. Light blue symbols and Photo 1 indicate an excavated grave. Red symbols and Photo 2 indicate the foundation of a stone wall. Green symbols and Photo 2 indicate a mosaic pavement.
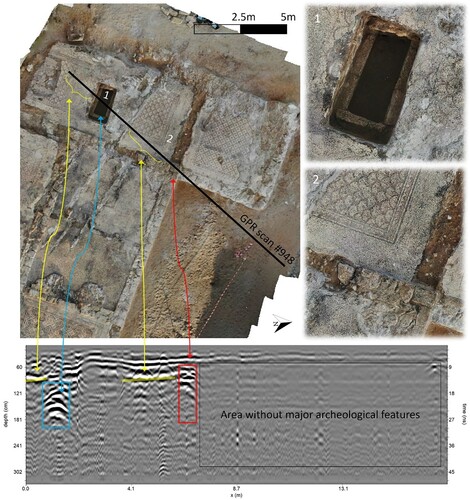
Figure 19. GPR scans and anomalies found in the suspected tombs.
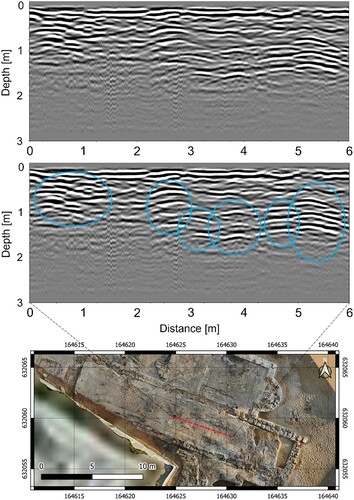
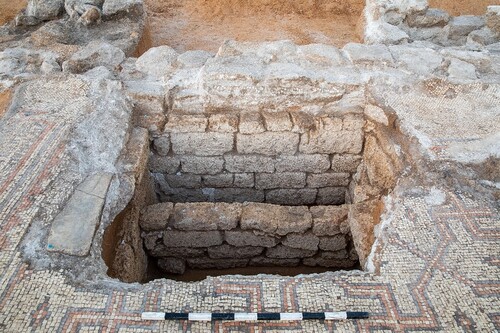
Figure 20. Two excavated graves, southern basilica aisle (created by Sasha Flit).
Data availability statement
Data may be available by request.