Figures & data
Figure 1. Schematic illustration of the preparation process of the PVDF/PVDF-HFP/PVDF composite microfibrous membrane.
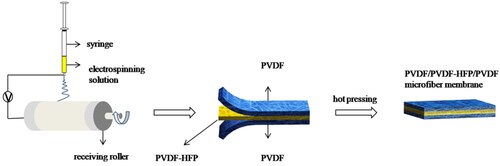
Figure 2. SEM images of P/H2/P membrane (a) top view; (b) cross-sectional image;(c) magnified image of circled region in (b); (d) Stress-strain curves of PVDF, PVDF-HFP, nHP-P/H2/P and PVDF/PVDF-HFP/PVDF composite membranes.
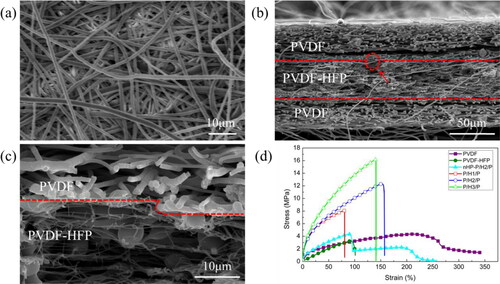
Figure 3. (a) DSC curves of the composite membranes; (b) crystallinity of PVDF and PVDF-HFP components in composite membrane; (c) porosity and electrolyte uptake ratio of different membranes; (d) photograph of different membranes after heat treatment at 25 °C and 130 °C for 0.5 h.
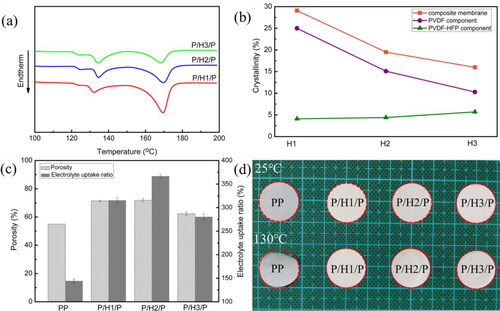
Figure 4. (a) Nyquist plots of SS/membrane/SS; (b) interfacial impedance of Li/membrane/LiFePO4 with different membranes; (c) the initial charge–discharge profiles of cells with different membranes at 0.2 C; (d) the rate performance of cells with different membranes; (e) the initial charge–discharge profiles of cells with different membranes at 2 C; (f) cycling performance of cells with different membranes at 1 C.
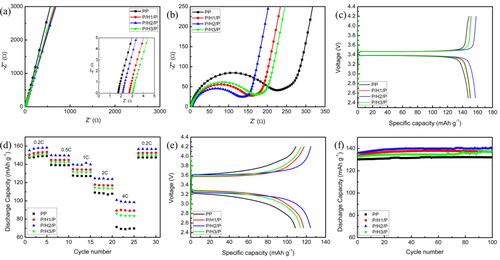
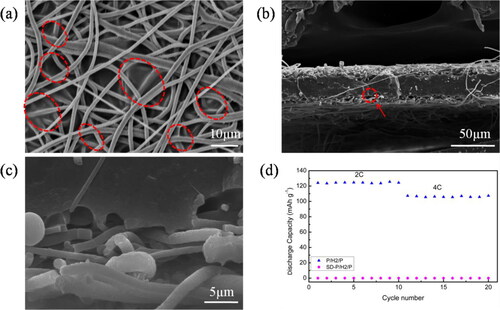
Figure 5. SEM images of SD-P/H2/P membrane (a) top view; (b) cross-sectional view; (c) magnified image of circled cross-sectional region; (d) Cycle performance of cells with P/H2/P and SD-P/H2/P membrane.