Figures & data
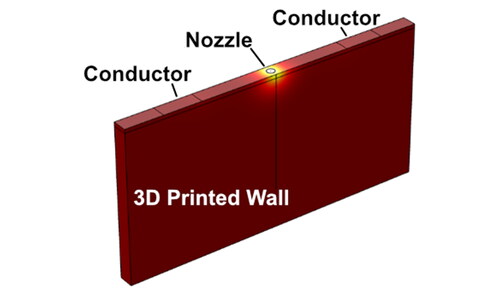
Figure 1. a) Schematic of DBD experimental setup; b) image of DBD experimental applicator with a diameter of 5.4 cm; c) COMSOL simulation of 3D printed wall with a single CNT-loaded conductive layer 1 mm in thickness which is coupled to plasma. The wall has a height of 40 mm, length of 80 mm, and width of 4 mm [Citation21].
![Figure 1. a) Schematic of DBD experimental setup; b) image of DBD experimental applicator with a diameter of 5.4 cm; c) COMSOL simulation of 3D printed wall with a single CNT-loaded conductive layer 1 mm in thickness which is coupled to plasma. The wall has a height of 40 mm, length of 80 mm, and width of 4 mm [Citation21].](/cms/asset/5ca5f29a-3b14-4466-ac94-fd7a330cb302/ynan_a_2229187_f0001_c.jpg)
Figure 2. Electric potential (V) in the center plane of the wall with a conductive surface layer of 1 mm in depth with a conductivity of 5 × 10⁻⁷ S/m. The wall has a height of 40 mm, length of 80 mm, and width of 4 mm.
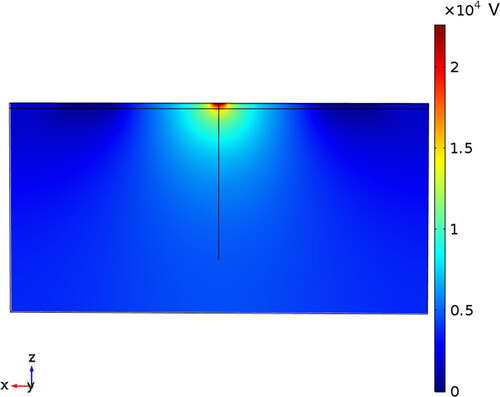
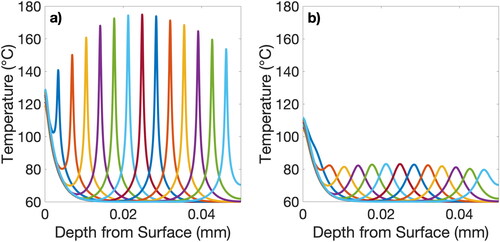
Figure 3. a) Temperature of the inside of the wall as a function of depth from the top surface, directly below the center of the nozzle at 100 s; b) Temperature of the outside surface of the wall along the z-axis (at the x- and y-center point) at 100 s; c) Temperature of the top surface of the wall directly below the nozzle as a function of time.
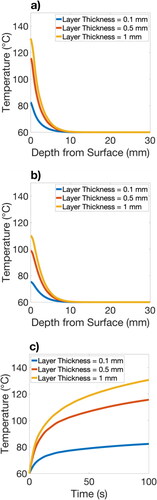
Figure 4. a) Example of a wall with an inclusion with a conductivity of 1x10⁻⁵ S/m in the center of the wall, directly below the nozzle; b) Center cutaway of a wall with an inclusion with a conductivity of 1 × 10⁻⁵ S/m in the precise center of the wall.
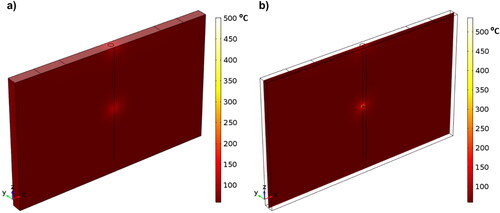
Figure 5. a) Electric potential (V) at the center plane of the wall with an inclusion at a depth of 1 mm. b) Electric potential (V) at center plane of the wall with an inclusion at a depth of 24 mm.
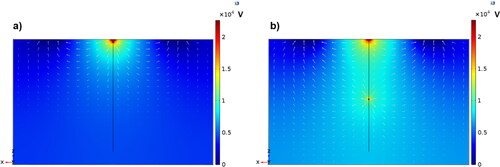
Figure 6. a) Temperature (°C) of the inside of the wall with an inclusion at varying positions along the z-axis directly below the center of the nozzle at 100 s. b) Temperature (°C) of the outside surface of the wall with an inclusion at various positions along the z-axis directly below the center of the nozzle at 100 s.