Figures & data
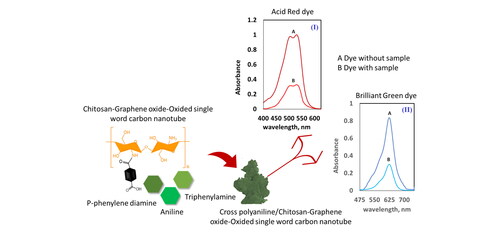
Figure 1. SEM images of Cross PANI (a), Cross PANI/GO-OXS NCs (b), Cross PANI/Chito-GO OXS NCs (c) NCs, and EDX of Cross PANI/Chito-GO OXS NCs (d).
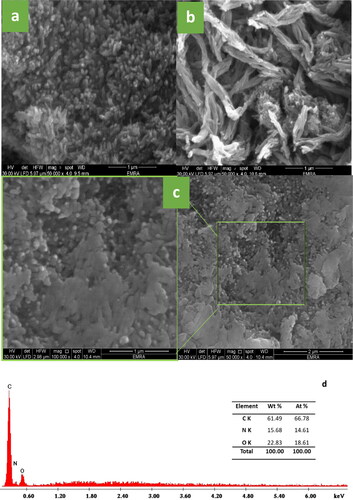
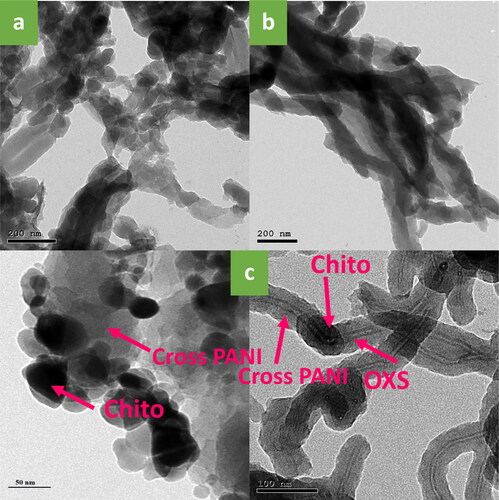
Figure 2. TEM images of Cross PANI (a), Cross PANI/GO-OXS NCs (b), and Cross PANI/Chito-GO-OXS NCs (c) NCs.
Scheme 1. Illustration of the proposed mechanism for manufacturing Cross PANI/Chito-GO-OXS NCs.
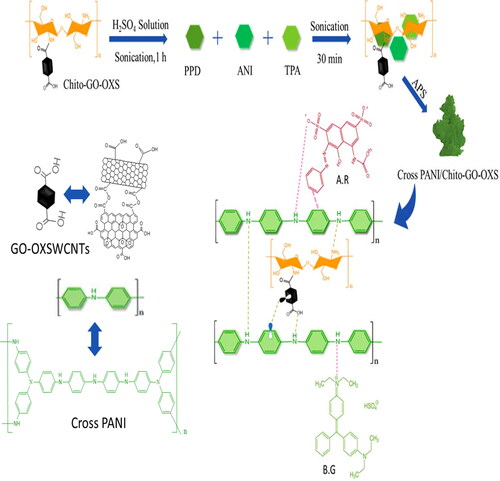
Figure 3. XRD patterns (a) and FTIR spectra (b) of Cross PANI, Cross PANI/GO-OXS, and Cross PANI/Chito-GO-OXS NCs; RAMAN spectra (c) and (d) isotherm curve of Cross PANI/Chito-GO-OXS NCs.
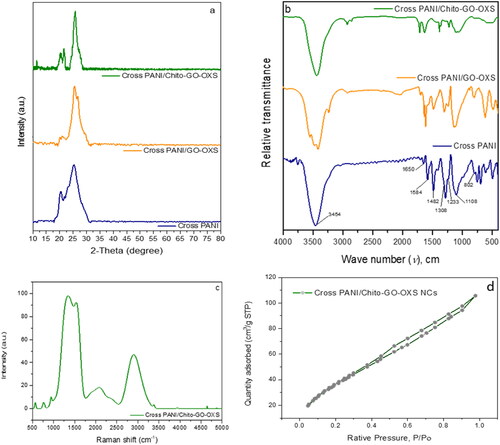
Table 1. The SBET, total pore volumes, and pore size of Cross PANI/Chito-GO-OXS NCs.
Figure 4. TGA (a) and DTG (b) curves of Cross PANI, Cross PANI/GO-OXS, and Cross PANI/Chito-GO-OXS NCs, and (c) TGA, DTG and DTA curves of Cross PANI/Chito-GO-OXS NCs.
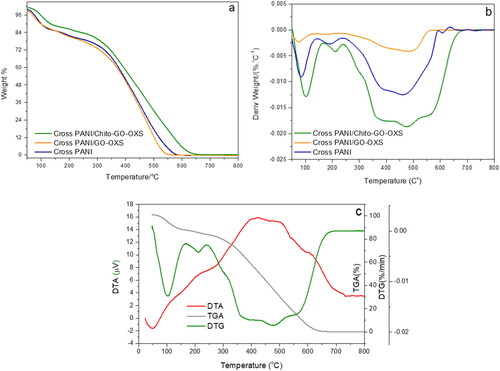
Table 2. Thermal behavior of Cross PANI, Cross PANI/GO-OXS, and Cross PANI/Chito-GO-OXS NCs.
Figure 5. Efficiency comparison of (a) Cross PANI/GO-OXS NCs and (b) Cross PANI/Chito-GO-OS NCs in removing AR1 and BG dyes from an aqueous phase.
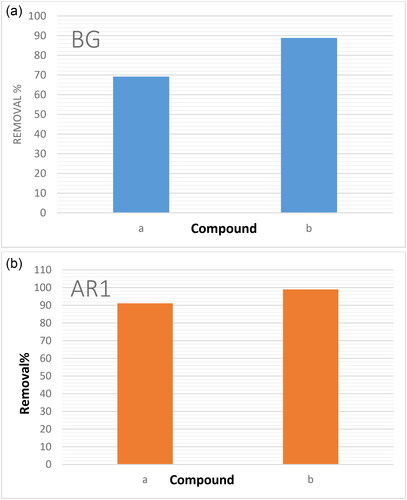
Figure 6. The electronic spectra of (A) Acid Red 1 dye (20 ppm) in the sample solution without Cross PANI/Chito-GO-OXS NCs, (B) after shaking in solution with Cross PANI/Chito-GO-OXS NCs (5 mg) (I), and (A) Brilliant Green dye (5 ppm) in the sample solution without Cross PANI/Chito-GO-OXS NCs (5 mg) and (B) after shaking in solution with Cross PANI/Chito-GO-OXS NCs (5 mg) (II).
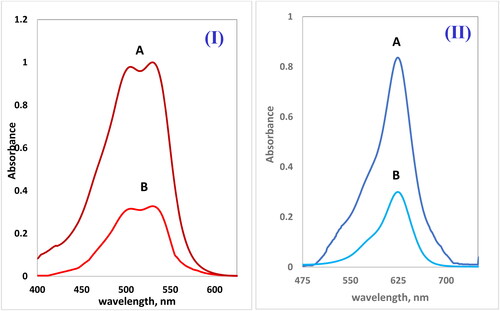
Figure 7. The influence of pH on the percentage (I) of adsorption of dyes BG (a) and AR1 (b) from solution samples by (0.005 and 0.0003 g) Cross PANI/Chito-GO-OXS NCs for AR1 and (0.005 and 0.0003 g) Cross PANI/Chito-GO-OXS NCs for BG dyes.
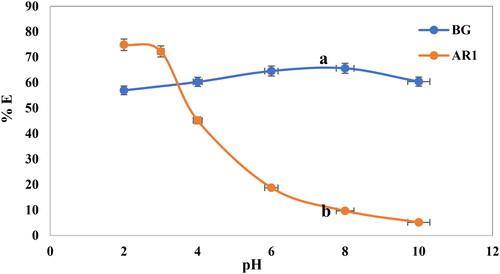
Figure 8. Effect of Cross PANI/Chito-GO-OXS NCs mass on dye adsorption of BG (a) and AR1 (b) at 22 °C temperature and contact period of 120 min.
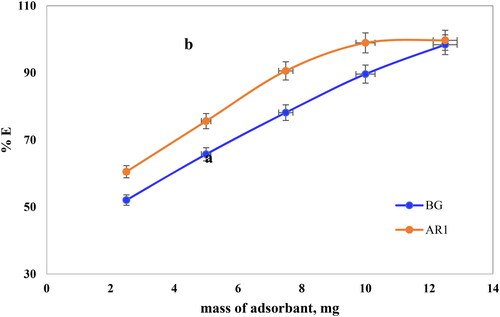
Figure 9. The effect of shaking duration on the percentage of removal dyes BG (a) and AR (b) by Cross PANI/Chito-GO-OXS NCs at 20 °C.
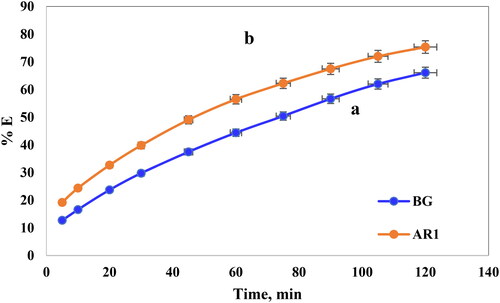
Figure 10. Temperature effect on the percentage of removal dyes BG (a) and AR1 (b) by Cross PANI/Chito-GO-OXS NCs with a contact time of 120 min.
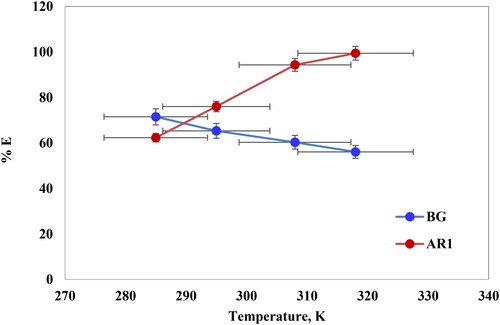
Figure 11. Effect of KNO3 concentration on the percentage of removal dyes BG (a) and AR1 (b) on Cross PANI/Chito-GO-OXS NCs at 20 °C.
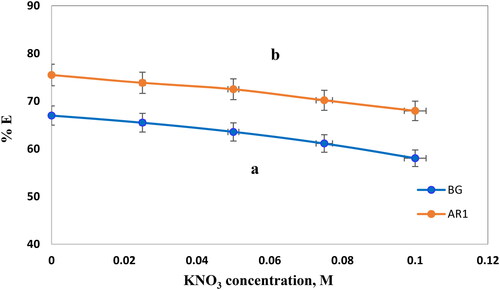
Table 3. Comparision of Cross PANI/Chito-GO-OXS NCs based on solution pH, equilibrium time, and qe with various other adsorbents for the removal of AR1 and BG dyes from aqueous medium.
Figure 12. Lagergren curve for AR1 BG dyes uptake on Cross PANI/Chito-GO-OXS NCs vs. time. The experimental conditions are specified in the batch extraction step.
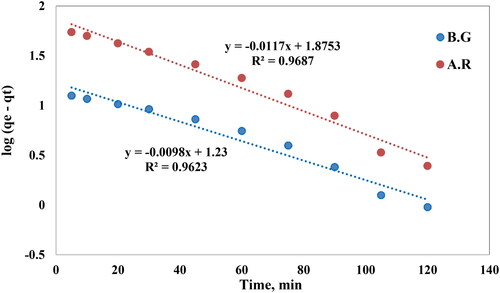
Figure 13. Pseudo-second order curves for AR1 and BG dye uptake onto Cross PANI/Chito-GO-OXS NCs vs. time. The experimental conditions are specified in the batch extraction step.
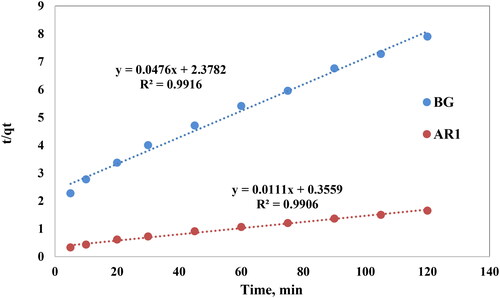
Figure 14. Curves of the Elovich model for dye uptake by Cross PANI/Chito-GO-OXS NCs vs. time. The experimental conditions are specified in the batch extraction step.
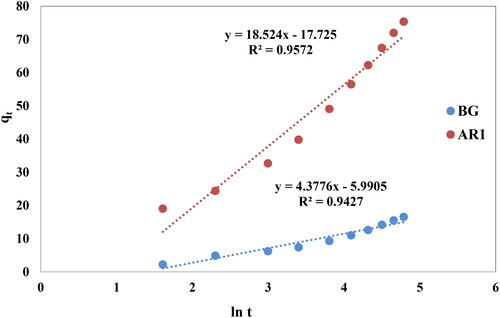
Table 4. The parameters for several kinetic models for the removal of BG dye and AR1 dye from Cross PANI/Chito-GO-OXS NCs were determined at 22 °C.
Figure 15. Intra-particle diffusion model for the AR1 and BG dyes removed from an aqueous solution by Cross PANI/Chito-GO-OXS NCs.
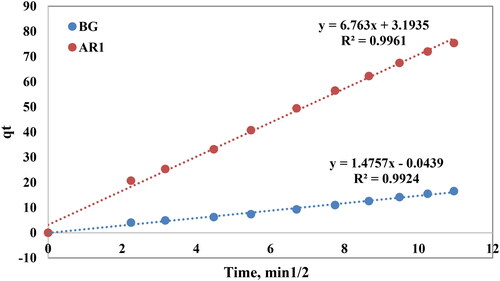
Figure 16. Curves showing ln Kc against 1000/T for BG dye and AR1 dye uptake from aquatic solution by Cross PANI/Chito-GO-OXS NCs.
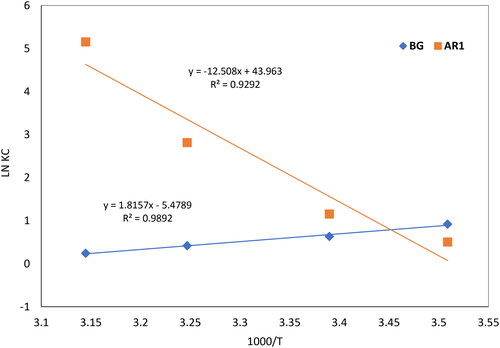
Table 5. Thermodynamic characteristics for AR1 and BG dye adsorption using Cross PANI/Chito-GO-OXS NCs.
Figure 17. The efficiency of AR1 and BG dyes removed by Cross PANI/Chito-GO-OXS NCs from various real three samples, (experimental conditions: 25 mL solution, contact time = 120 min, pH solution = 6, temperature = 295 K, 12.5 mg of Cross PANI/Chito-GO-OXS NCs and 5 mg/L concentration for BG dye, and for the AR1 dye 25 mL solution, contact time = 120 min, pH solution = 2, temperature = 295 K, 12.5 mg of Cross PANI/Chito-GO-OXS NCs and 20 mg/L concentration).
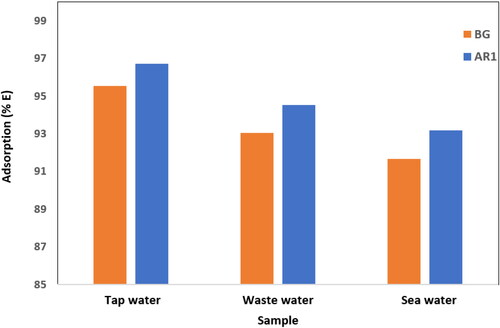
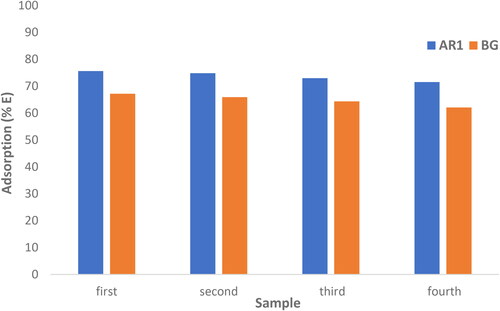
Figure 18. Removal performance of Cross PANI/Chito-GO-OXS NCs towards AR1 and BG dyes over four cycles.