
Figures & data
Figure 1. Schematic illustration of Bacterial cellulose production, acid hydrolysis and Nanocomposite formation.
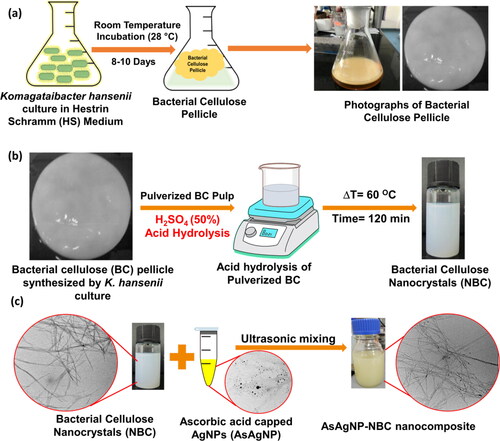
Figure 2. Bacterial cellulose, nanomaterials and composite characterization (a) UV-Visible absorbance spectra;(b) FTIR spectra, TEM Micrographs of (c) NBC (Inset: unhydrolyzed Bacterial cellulose (BC)), and (d) AsAgNP-NBC blend (Inset: Zoomed in image of embedded AsAgNPs in the NBC matrix).
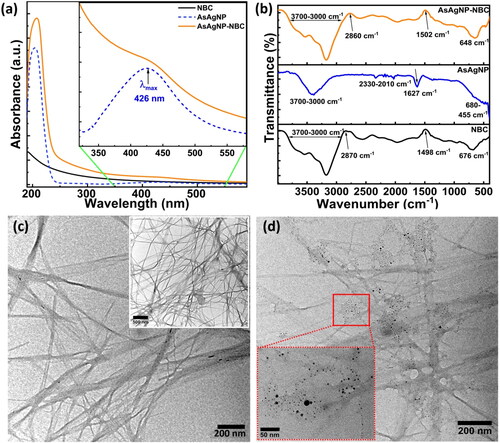
Figure 3. Optimization on three electrode system(a) Schematic of the 3-electrode system/set-up and electrode modification, (b) CV depicting detection of Hg2+ by the AsAgNP-NBC modified GCE at varying Hg2+ concentration from 10 nM to 2 µM, (c) Anodic region zoomed showing a shift in the anodic peak on interaction with increasing concentrations of mercury.
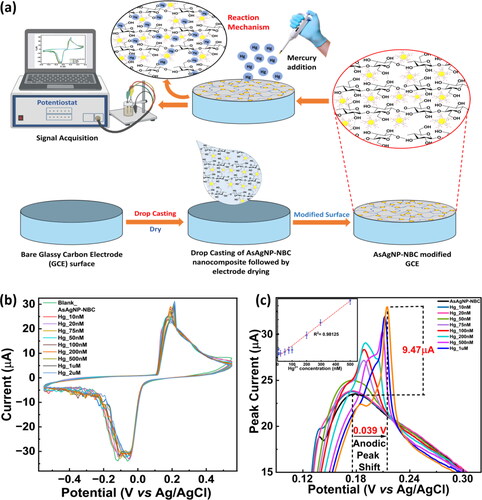
Figure 4. Photocurrent enhancement on modified SPE: (a) Schematic representation of the modified SPE and Photocurrent enhancement experiment; (b) CV measurements on AsAgNP-NBC modified SPE chip irradiated with 455 nm light source (Inset: Calibration plot representing oxidation signals measured on SPE irradiated with 455 nm light source with varying Hg2+ concentration (0.025–10 nM); (c) Comparative CV measurement of10nM Hg2+ on AsAgNP-NBC modified SPE chip with (Blue color) and without (Green color) irradiation, and (d) Anodic and Cathodic peak current comparison showing enhancement in peak currents after irradiation with 455 nm light.
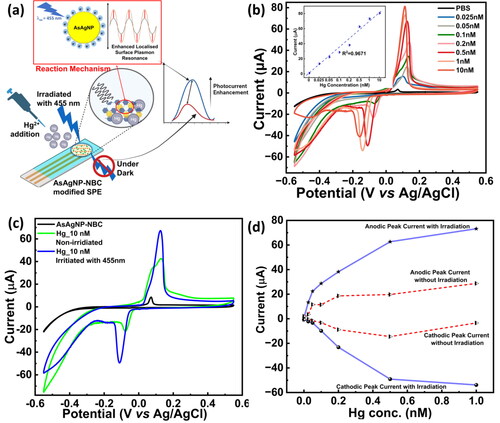
Table 1. Comparison between anodic peak current, photocurrent enhancement and photoresponsivity of bare and modified SPE.
Figure 5. DPV measurements and selectivity experiments: (a) DPV measurements on AsAgNP-NBC modified SPE chip irradiated with 455 nm light source (Linear Range: 25 pM–50 nM) (b) DPV measurements on AsAgNP-NBC modified SPE chip without irradiation (Linear Range: 25 pM–50 nM), and (c) CV measurements conducted for interfering ions (Interfering metal ions concentration- 100 nM; Hg2+ concentration- 10 nM).
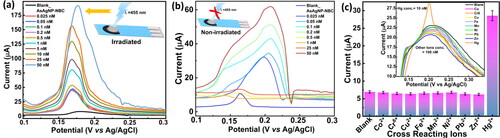
Table 2. Analytical data of the proposed sensing system with respect to CV and DPV measurements.
Supplementary information.docx
Download MS Word (3.9 MB)Data availability statement
Data will be made available upon request.