
Figures & data
Figure 1. Nanofibers at 8,000× magnification: (a) SA-L and b) CS-L.
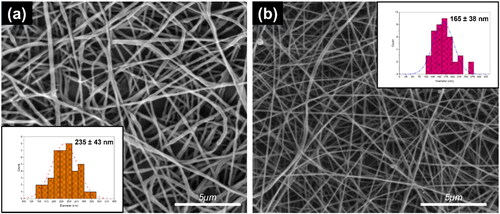
Figure 2. (a) XRD diffractogram, (b) FTIR fingerprints, (c) thermal behavior (TGA), (d) liquid absorption, and (e, f) release behavior of SA-L and CS-L nanofibers.
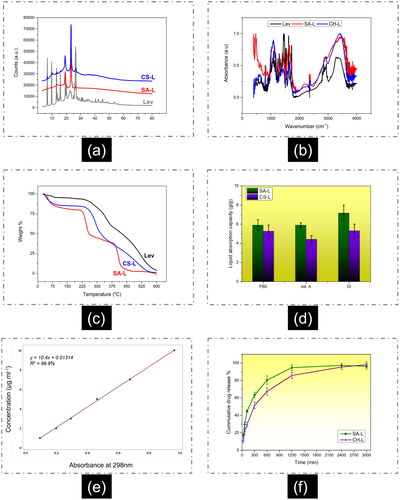
Figure 3. Biocompatibility analysis of keratinocyte HaCaT cell line (a) WST-1 mitochondrial activity, (b) LDH cytotoxicity analysis, and (c) cell viability in the presence of SA-L and CS-L nanofibers.
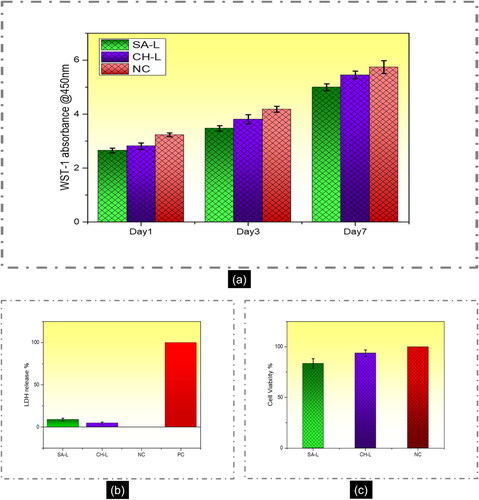
Figure 4. SEM micrographs: (a) HaCaT cell adhesion on SA-L and CS-L nanofibers after 3 and 7 days of incubation (b) confocal images of keratinocytes actin stained (red) and nuclei stained (blue).
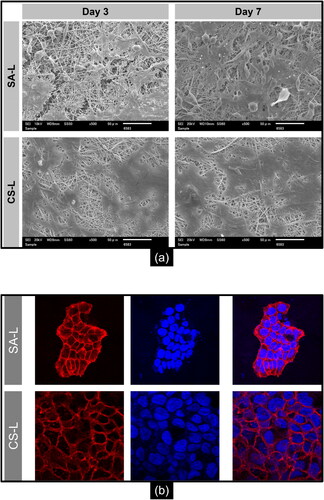
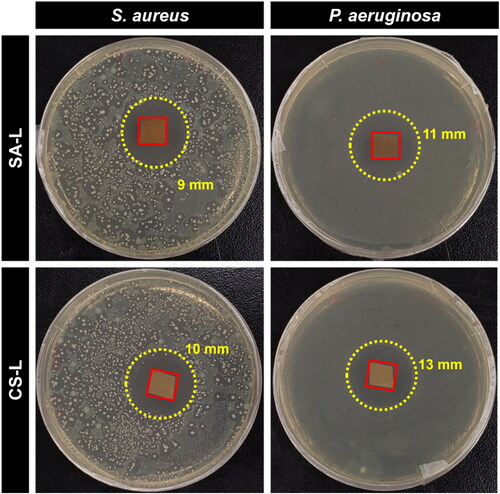
Figure 5. Antibacterial activity of drug-loaded SA-L and CS-L nanofibers against S. aureus and P. aeruginosa.
Data availability
No data was used for the research described in the article.