Figures & data
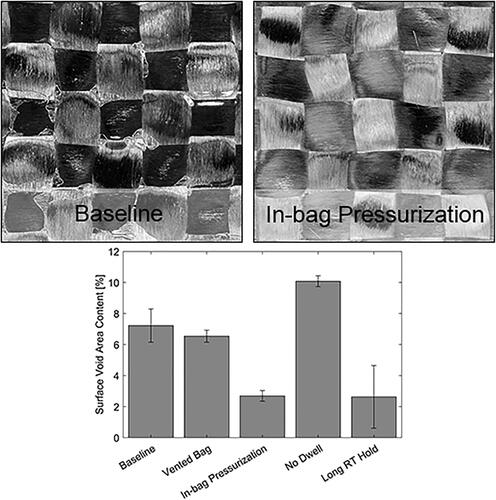
Figure 1. Schematic of sandwich panel layup. Laminates were fabricated using the same layup procedure, including consumables, but omitting the adhesive and core insert.
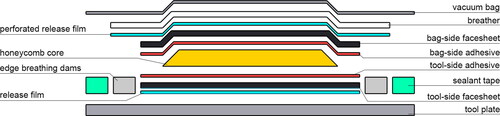
Table 1. Testing conditions for autoclave processing. All pressures are absolute. For each testing condition, two sandwich panel samples were fabricated. Additionally, a comparison laminate was made for the baseline and vented bag conditions.
Figure 2. Sample measurements of tow shearing. To measure tow shearing, individual sections created by the fabric weave were outlined and the circularity measured. Values were then compared to a baseline established using the vacuum laminate sample.
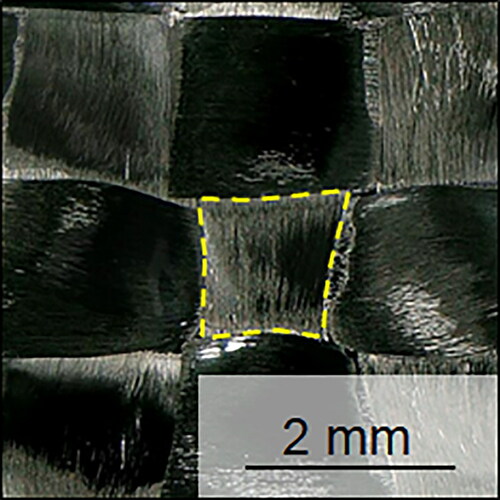
Figure 3. Diagram of oven cure set-up for in situ visualization of the tool-side surface. The use of the framed glass tool plate reduced thermal gradients (compared to placing samples directly on the oven window). A digital microscope is placed outside the oven to observe the tool-side facesheet through the oven window and glass tool plate.
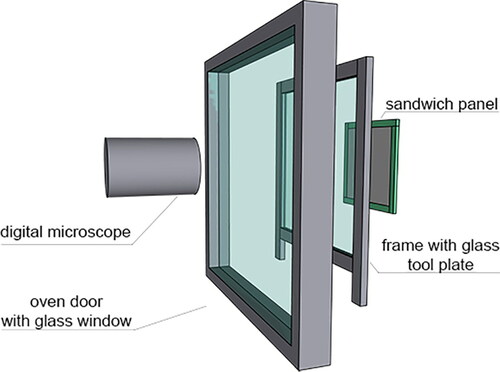
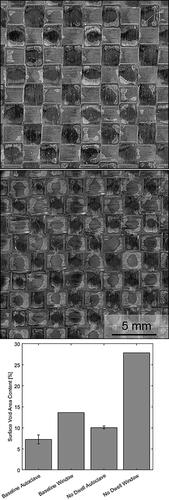
Figure 4. Surface images of autoclave-cured samples: A, baseline vacuum laminate; B, baseline vacuum sandwich; C, vented bag laminate; D, vented bag sandwich; E, in-bag pressurization sandwich; F, in-bag pressurization sandwich with crushed core; G, long room-temperature vacuum hold sandwich; H, no intermediate dwell sandwich. Voids were overlaid with black for better visibility.
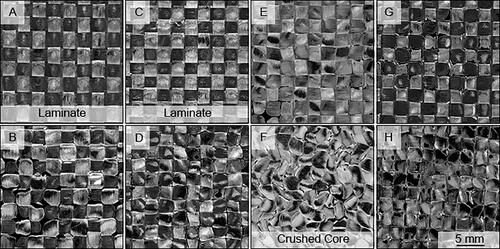
Figure 5. Surface images of baseline vacuum panel under the honeycomb core (top) and in the flange (bottom).
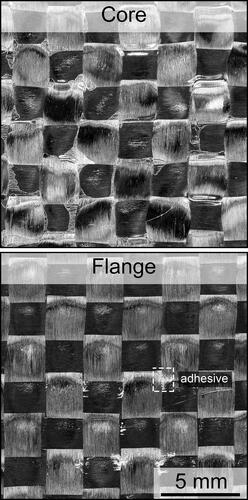
Figure 6. Surface void area content (top) and circularity (as deviation from the baseline laminate average, bottom) for autoclave-cured samples.
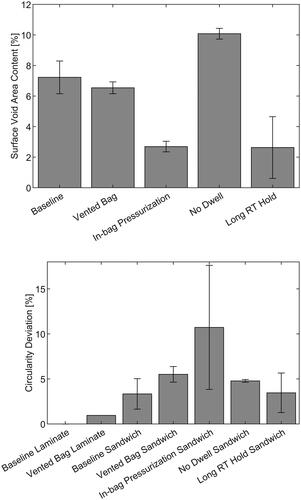
Figure 7. Cross-sections showing internal structure of tool-side facesheet and bond-line of autoclave-cured samples: A, baseline vacuum; B, vented bag; C, in-bag pressurization; D, in-bag pressurization with crushed core; E, long room-temperature vacuum hold; F, no intermediate dwell.
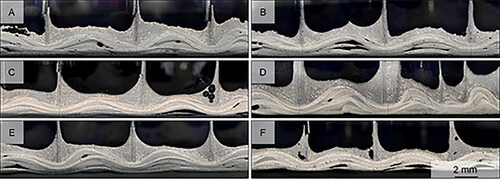
Figure 8. Surface vs. internal porosity (top) and circularity (as deviation from baseline laminate) vs. maximum facesheet thickness (bottom).
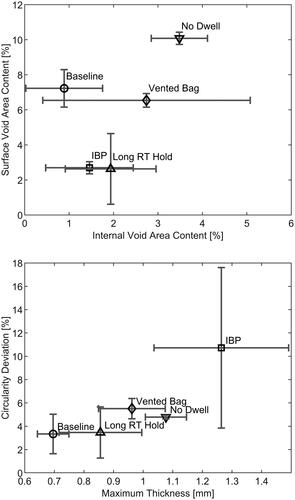
Figure 9. Frames from time-lapse video for baseline oven window cure test, with times marked along with measured temperature and modeled viscosity. At t1, entrapped air was observed moving toward pinholes in the surface ply and disappearing from view. At t2, new voids began forming, with some remaining trapped in the surface after cure.
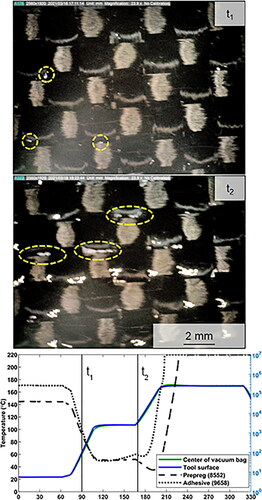
Figure 10. Surfaces of oven window cure parts: baseline vacuum (top) and no room-temperature vacuum hold/no intermediate dwell (bottom). Surface void area content for oven window cure parts compared to autoclave-cured equivalents. Note that, for the autoclave-cured sample, the no-dwell case did include a room-temperature vacuum hold.