
Figures & data
Figure 1. Schematic of the self-assembled DBD cold-plasma reactor.
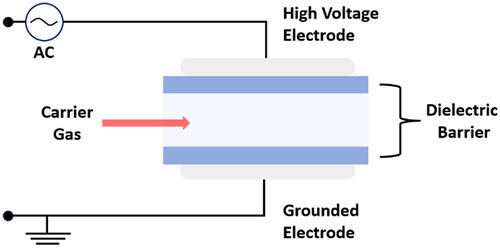
Table 1. Sample treatment and code names for MP and PMB, where ‘xxx’and ‘yy’ represent the temperature and duration, respectively, of the thermal oxidation treatment.
Figure 2. (a) Schematic of the contact angle measurement of MP samples. The effects of thermal oxidation treatment duration on the critical surface tension of MP (b) and the contact angles of (c) DW and (d) EG.
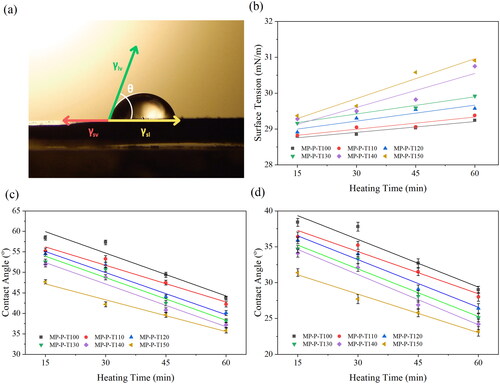
Figure 3. The influence of cold plasma and thermal oxidation on the FTIR spectrum of MP.
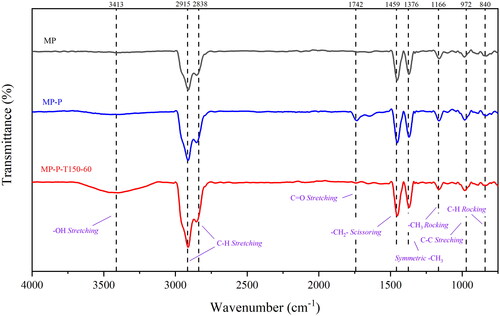
Figure 4. Schematic of the chain-scission and oxidation reaction resulting in the formation of LMWOM and a boundary layer on the surface of the polymer.
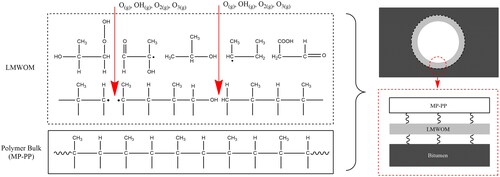
Figure 5. DSC thermogram of the influence of cold plasma and thermal oxidation on MP samples.
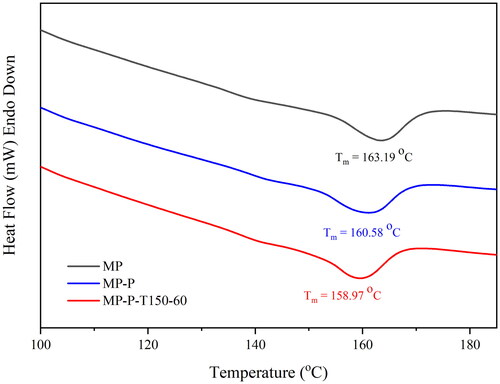
Figure 6. OIT analysis results for MP samples heated to 110 °C, 130 °C, 150 °C, 170 °C, and 190 °C.
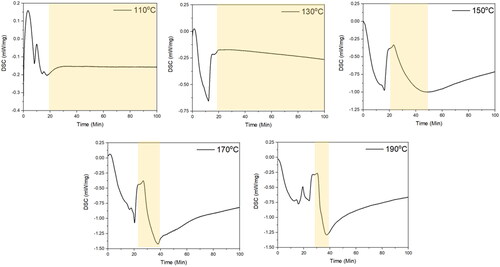
Figure 7. Micrographs of (a) PMB–MP, (b) PMB–MP-P, and (c) PMB–MP-P–T150–60 mixtures; particle size analysis and distribution for (d) PMB–MP, (e) PMB–MP-P, and (f) PMB–MP-P–T150–60 mixtures.
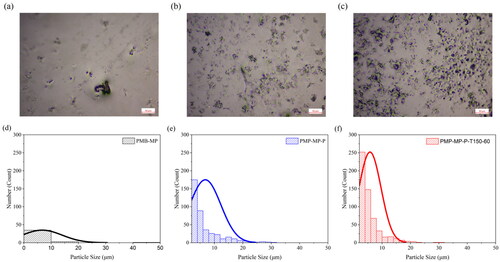
Table 2. Average particle size for the designated PMB mixtures.
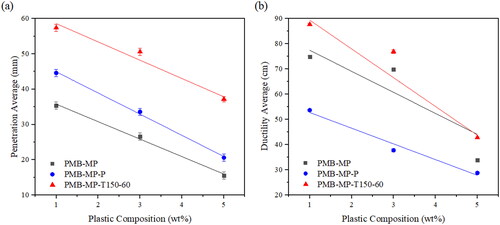
Figure 8. The influence of cold plasma and thermal oxidation treatments on the mechanical properties of the PMB mixture: (a) average ductility and (b) average penetration.
Data availability statement
The data that support the findings in this investigation can be made available from the corresponding author upon reasonable request.