
Figures & data
Figure 1. The utilised gravity data set’s distribution.
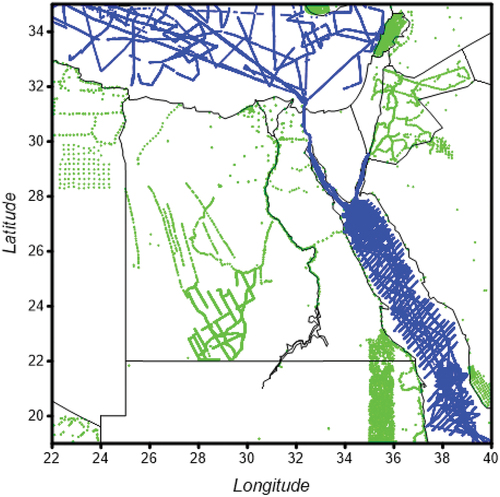
Figure 2. The fine 3′′×3′′digital terrain model EGH13S03, after (Abd-Elmotaal et al. Citation2013). Units in [m].
![Figure 2. The fine 3′′×3′′digital terrain model EGH13S03, after (Abd-Elmotaal et al. Citation2013). Units in [m].](/cms/asset/aafc405c-8f32-41d7-8083-0efd5981d439/tjag_a_2381955_f0002_oc.jpg)
Figure 3. The conventional remove-restore method.
Figure 4. The window remove-restore technique.
Table 1. Standard deviations for the effect of T/I masses on gravity for different resolutions of DHMs. Unites in mgal.
Table 2. Range for the effect of T/I masses on gravity for different resolutions of DHMs. Unites in mgal.
Table 3. CPU time elapsed for computing the effect of terrain of gravity for different resolutions of DHMs. Unites in minute.
Figure 5. Difference in gravity anomalies between using fine DHM x
and using fine DHM
x
with the same coarse DHM
x
[units in mgal].
![Figure 5. Difference in gravity anomalies between using fine DHM 1′′ x1′′ and using fine DHM 3′′ x 3′′ with the same coarse DHM 30′′ x30′′ [units in mgal].](/cms/asset/f85e6398-a8a6-47c4-91c9-fd81de519a3d/tjag_a_2381955_f0005_oc.jpg)
Table 4. The statistics of the difference in the indirect effect between using fine DHM x
with coarse DHM
x
and using other fine DHM
with different coarse DHM [units in cm].
Figure 6. Difference in the indirect effect between using fine DHM x
and using fine DHM
x
with the same coarse DHM
x
[units in cm].
![Figure 6. Difference in the indirect effect between using fine DHM 1′′ x 1′′ and using fine DHM 3′′ x 3′′ with the same coarse DHM 30′′ x 30′′ [units in cm].](/cms/asset/4356928f-30d8-4dfc-8124-8bcccec979fc/tjag_a_2381955_f0006_oc.jpg)
Figure 7. Difference in the indirect effect between using fine DHM x
with coarse DHM
x
and using fine DHM
x
with coarse DHM
x
[units in cm].
![Figure 7. Difference in the indirect effect between using fine DHM 1′′ x 1 ′′ with coarse DHM 30′′ x 30′′ and using fine DHM 15′′ x 15′′ with coarse DHM 3′ x 3′ [units in cm].](/cms/asset/66283199-a47e-4be0-8df1-aae2b4f99ec6/tjag_a_2381955_f0007_oc.jpg)
Table 5. The statistics of the difference in the gravity contribution using fine DHM
x
with coarse DHM
X
and using the same fine DHMs with different coarse DHMs [Units in cm].
Figure 8. Difference in gravity contribution when using fine DHM x
and using fine DHM
x
with the same coarse DHM
x
[units in cm].
![Figure 8. Difference in gravity contribution when using fine DHM 1′′ x 1′′ and using fine DHM 3′′ x 3′′ with the same coarse DHM 30′′ x 30′′ [units in cm].](/cms/asset/c7a99088-bf44-4237-8598-27689dbb9941/tjag_a_2381955_f0008_oc.jpg)
Figure 9. Differences in gravity contribution on geoid undulation between using fine DHM x
with coarse DHM
x
and using fine DHM
x
with coarse DHM
x
[units in cm].
![Figure 9. Differences in gravity contribution on geoid undulation between using fine DHM 1′′ x 1 ′′with coarse DHM 30′′ x 30′′ and using fine DHM 15′′ x 15′′ with coarse DHM 30′′ x 30′′ [units in cm].](/cms/asset/b677ef31-36b4-49a2-a06f-cc96b9710bd7/tjag_a_2381955_f0009_oc.jpg)
Figure 10. Histogram for the differences in gravity anomalies contribution on geoid undulation between using fine DHM x
with coarse DHM
x
and using different fine DHM with the same coarse DHMs resolutions [units in cm].
![Figure 10. Histogram for the differences in gravity anomalies contribution on geoid undulation between using fine DHM 1′′ x1 ′′ with coarse DHM 30′′x30′′ and using different fine DHM with the same coarse DHMs resolutions [units in cm].](/cms/asset/9752ab4f-0e39-444f-b7aa-bf6b570e7dca/tjag_a_2381955_f0010_oc.jpg)
Figure 11. Histogram for the differences in gravity contribution on geoid undulation between using fine DHM x
with coarse DHM
x
and using different coarse DHMs resolutions with the same fine DHMs resolutions [units in cm].
![Figure 11. Histogram for the differences in gravity contribution on geoid undulation between using fine DHM 1′′ x 1 ′′ with coarse DHM 30′′ x 30′′ and using different coarse DHMs resolutions with the same fine DHMs resolutions [units in cm].](/cms/asset/5b40414c-1a4c-4a8f-b139-22e3a75a2874/tjag_a_2381955_f0011_oc.jpg)
Table 6. The statistics of the difference in the geoid undulation between using fine DHM x
with coarse DHM
x
and using the same fine DHM
with different coarse DHM units in [cm].
Figure 12. Difference in geoid undulations between using fine DHM x
and using fine DHM
x
with the same coarse DHM
x
[units in cm].
![Figure 12. Difference in geoid undulations between using fine DHM 1′′ x1′′ and using fine DHM 3′′ x 3′′ with the same coarse DHM 30′′ x30′′ [units in cm].](/cms/asset/18db2dd4-42ae-4d50-85f4-0cac600bf6e4/tjag_a_2381955_f0012_oc.jpg)
Figure 13. Difference in geoid between using fine DHM x
with coarse DHM
x
and using fine DHM
x
with coarse DHM
x
[Units in cm].
![Figure 13. Difference in geoid between using fine DHM 1′′ x 1′′ with coarse DHM 30′′ x 30′′ and using fine DHM 15′′ x 15′′ with coarse DHM 30′′ x 30′′ [Units in cm].](/cms/asset/4d39b774-776e-452b-8ba5-5bdd8ad68176/tjag_a_2381955_f0013_oc.jpg)
Figure 14. Histogram for the differences in total geoid undulation between using fine DHM x
with coarse DHM
x
and using different fine DHM with the same coarse DHMs resolutions [units in cm].
![Figure 14. Histogram for the differences in total geoid undulation between using fine DHM 1′′ x 1 ′′with coarse DHM 30′′ x 30′′ and using different fine DHM with the same coarse DHMs resolutions [units in cm].](/cms/asset/482f4f66-30b7-4a53-9a13-194049fc3cf3/tjag_a_2381955_f0014_oc.jpg)
Figure 15. Histogram for the differences in total geoid undulation between using fine DHM x
with coarse DHM
x
and using different coarse DHMs resolutions with the same fine DHMs resolutions [units in cm].
![Figure 15. Histogram for the differences in total geoid undulation between using fine DHM 1′′ x 1 ′′ with coarse DHM 30′′ x 30′′ and using different coarse DHMs resolutions with the same fine DHMs resolutions [units in cm].](/cms/asset/7216b827-3fd6-4e62-841b-353717b7581d/tjag_a_2381955_f0015_oc.jpg)
Table 7. Statistics of differences between the computed geoid for Egypt and the corresponding ones from (El-Ashquer et al. Citation2016) as well as the GPS/levelling data obtained from HARN.