Figures & data
Figure 1. BMDMs produce IL-1β in response to T.rubrum conidia but succumb to hyphae growth. LPS-primed BMDMs were incubated with T.rubrum conidia for 4, 6, 8 and 10 h (no fungi in control wells). (A) Interaction outcome was analyzed by optical microscopy (1000×) and arrows indicate fungal structures. (B) IL-1β levels quantified in the culture supernatants expressed as mean ± SEM. Two-way ANOVA and Bonferroni posttest: ***P < 0.001. Cytokine data are pooled from 3 independent experiments and microscopy photos taken from one experiment (representative of 3 independent experiments) are shown.
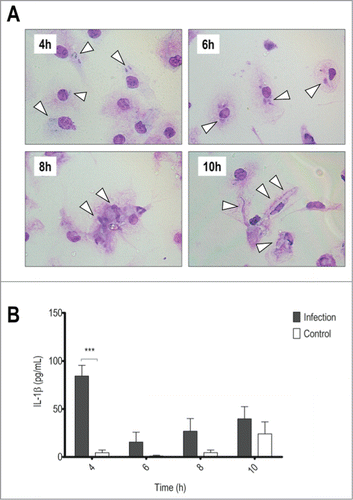
Figure 2. NLRP3 and ASC deficiency reduces IL-1β secretion, but only lack of ASC interferes in phagocytosis. LPS-primed NLRP3−/− or ASC−/− BMDMs were incubated with T.rubrum conidia for 4, 6, 8 and 10 h (no fungi in control wells). (A) NLRP3−/− Interaction outcome and (B) ASC−/− Interaction outcome analyzed by optical microscopy (1000×). Arrows indicate fungal structures. (C) IL-1β production by NLRP3−/− BMDMs and (D) IL-1β levels produced by ASC−/− BMDMs. (E) ASC−/− BMDMs were incubated with T.rubrum conidia for 4 h and conidia internalization was counted by optical microscopy. Results expressed as mean ± SEM. Two-way ANOVA and Bonferroni post test: *P < 0.05; **P < 0.01; ***P < 0.001. Cytokine data pooled from 2 independent experiments performed, in triplicate wells each, are shown. Microscopy photos taken from one experiment (representative of 2 independent experiments triplicate wells each) are shown.
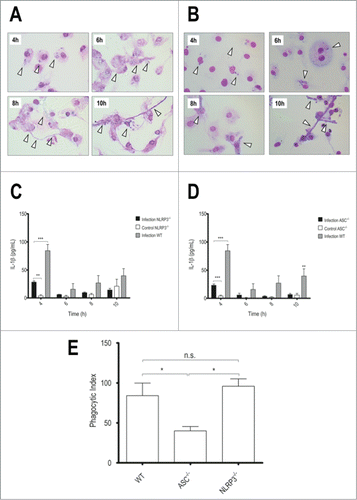
Figure 3. Caspase-1/-11 absence accelerates hyphae development and reduces IL-1β secretion. LPS-primed caspase-1/-11−/− BMDMs were incubated with T.rubrum conidia for 4, 6, 8 and 10 h (no fungi in control wells). (A) Interaction outcome was analyzed by optical microscopy (1000×) and arrows indicate fungal structures. (B) IL-1β levels quantified in the culture supernatants expressed as mean ± SEM. Two-way ANOVA and Bonferroni posttest: ***P < 0.001. Cytokine data are pooled from 2 independent experiments performed in triplicate wells each. Microscopy photos taken from one experiment (representative of 2 independent experiments, triplicate wells each) are shown.
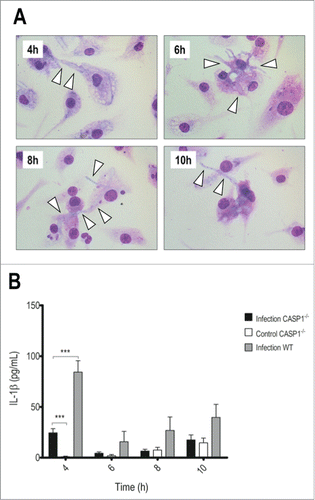
Figure 4. Impaired IL-1 signaling leads to faster hyphae development and reduced IL-1β production. LPS-primed IL-1R−/− BMDMs were incubated with T.rubrum conidia for 4, 6, 8 and 10 h (no fungi in control wells). (A) Interaction outcome was analyzed by optical microscopy (1000×) and arrows indicate fungal structures. (B) IL-1β levels quantified in the culture supernatants. Two-way ANOVA and Bonferroni posttest: *P < 0.05; ***P < 0.001. (C) Fungal loads in WT and IL-1R−/− BMDMs determined by CFU assay. Data expressed as mean ± SEM. Cytokine and CFU data were pooled from 2 independent experiments performed in triplicate wells each. Microscopy photos taken from one experiment (representative of 2 independent experiments, triplicate wells each) are shown.
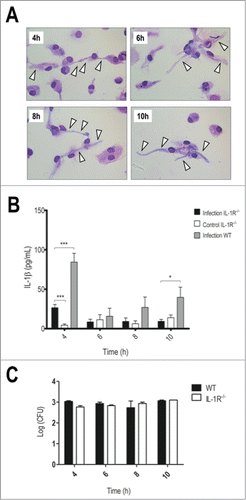
Figure 5. T.rubrum affects preferentially the liver but not the spleen. Animals were infected i.P. with T.rubrum conidia (5 × 10⁶/ animal) and fungal burden were determined 7 and 14 days post infection (dpi). (A) Fungal burden in Liver. (B) Fungal burden in Spleen. Unpaired t-test: no significance found. Data pooled from 3 to 4 independent experiments (groups of 3 animals in each experiment) expressed as mean ± SEM.
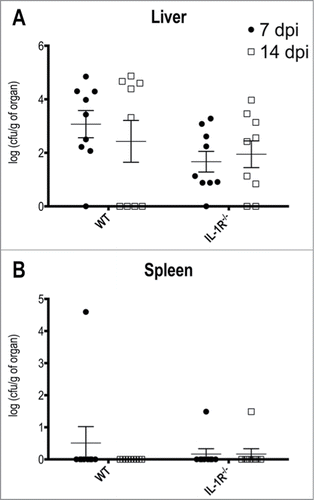
Figure 6. IL-1R−/− mice show defective IL-17 production in response to T.rubrum. Animals were infected i.p. with T.rubrum conidia (5 × 10⁶/ animal) and cytokines levels (IL-1β; IFN-γ; IL-4 and IL-17) were determined in liver homogenates (A) 7 and (B) 14 days post infection (dpi). Two-way ANOVA and Bonferroni posttest: *P < 0.05; ***P < 0.001. Data, expressed as mean ± SEM, were pooled from 2 to 4 independent experiments (groups of 3 animals in each experiment).
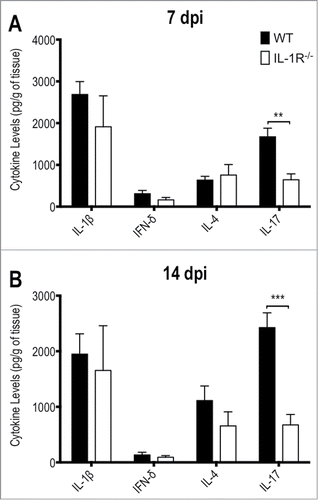
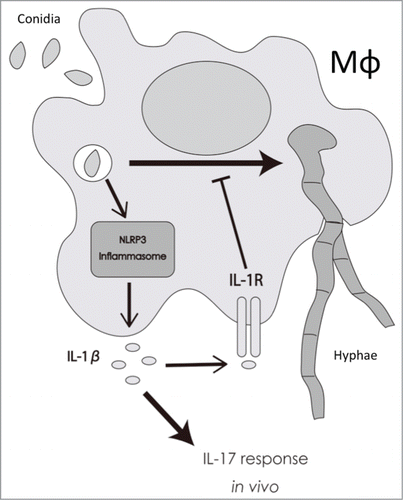
Figure 7. Proposed model for the role of IL-1β in response to T.rubrum. Macrophages phagocytose T.rubrum, leading to the activation of NLRP3 inflammasome and, consequently, to IL-1β production. By your turn, IL-1β, signaling through IL-1R, delays fungal development into hyphae inside the macrophages and also helps to shape the IL-17 response in vivo.