964
Views
8
CrossRef citations to date
0
Altmetric
Research Paper

Rapid chemical decontamination of infectious CJD and scrapie particles parallels treatments known to disrupt microbes and biofilms

, &
Pages 787-801 | Received 17 Apr 2015, Accepted 16 Sep 2015, Published online: 14 Dec 2015

Figures & data

Figure 1. Rapid concentration of FU-CJD infectious particles from GT1 neuronal cells. (A) Simplified diagram of subcellular fractionation that yields highly infectious p18 particles with reduced protein, PrP/PrP-res and nucleic acids. (B) Representative Western blot of sequential purification steps where the cell equivalent loads are indicated at the top of each lane. The % of starting whole cell PrP is calculated at the bottom of each lane and the % of that fraction that is PrP-res (adjacent +PK lanes) is indicated below this. For example, PrP-res is 45% (or 0.45x) of the starting whole cell PrP (lane 1, 100%), and the s18 retains 33% of the whole cell PrP (lane 9) with 18% of this in the PrP-res form (lane 10). Note the increased 3x-6x lane loads needed to detect PrP and PrP-res in the concentrated p18 particles. The FU-CJD agent specific 13 kd PrP band in GT1 cells Citation3,42 is at arrow. (C) % tubulin in above blot shows the partitioning in each sequential fraction (PK – lanes), and tubulin is completely digested by PK (+ lanes). (D) Gold stain of the same blot demonstrates the markedly decreased protein in concentrated p18 particles. The p18 pattern of bands is clearly different than the non-infectious s18 (compare lanes 9 and 11). After digestion, the intense PK band at 29 kd (arrow) is dominant, with few other remaining bands. Starting whole cells (WC), nuclei (Nuc) and markers (kd) indicated.
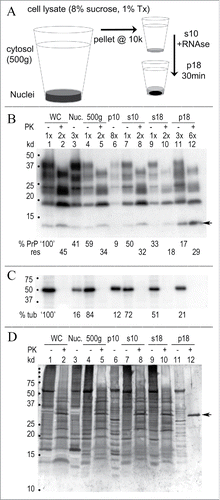
Figure 1. Rapid concentration of FU-CJD infectious particles from GT1 neuronal cells. (A) Simplified diagram of subcellular fractionation that yields highly infectious p18 particles with reduced protein, PrP/PrP-res and nucleic acids. (B) Representative Western blot of sequential purification steps where the cell equivalent loads are indicated at the top of each lane. The % of starting whole cell PrP is calculated at the bottom of each lane and the % of that fraction that is PrP-res (adjacent +PK lanes) is indicated below this. For example, PrP-res is 45% (or 0.45x) of the starting whole cell PrP (lane 1, 100%), and the s18 retains 33% of the whole cell PrP (lane 9) with 18% of this in the PrP-res form (lane 10). Note the increased 3x-6x lane loads needed to detect PrP and PrP-res in the concentrated p18 particles. The FU-CJD agent specific 13 kd PrP band in GT1 cells Citation3,42 is at arrow. (C) % tubulin in above blot shows the partitioning in each sequential fraction (PK – lanes), and tubulin is completely digested by PK (+ lanes). (D) Gold stain of the same blot demonstrates the markedly decreased protein in concentrated p18 particles. The p18 pattern of bands is clearly different than the non-infectious s18 (compare lanes 9 and 11). After digestion, the intense PK band at 29 kd (arrow) is dominant, with few other remaining bands. Starting whole cells (WC), nuclei (Nuc) and markers (kd) indicated.

Figure 2. Urea and thiourea (ThU) effects after 1 hr at 22°C on p18 proteins. (A): Representative Western blot shows residual PrP/PrP-res in the p18 (here taken as “100%” for simplicity) with the % of the p18 solubilized (sol) and the % of the p18 that pellets (insol) after chemical treatment. Buffer treated control particles (labeled untreated) are shown in lanes 1-6; 4M urea in lanes 7-12, 1M thiourea (ThU) + 5% β-ME in lanes 13-18, with 4M urea, 1M ThU + 5% β-ME in lanes 19-24. The %PrP and %PrP-res amounts in each p18 partition are shown at the bottom of each lane (- and +PK). Faint standard PrP-res bands of 17-27 kd are present but reproduce poorly in these less exposed films (lanes 4, 10 and 12). (B): Tubulin shows equal loads for each treatment (p18 start lanes); missing tubulin band in lanes 11-12 due to inadequate antibody exposure as evident by its white background vs. the rest of blot. (C): Gold stained proteins. Strong PK band at 29 kd (arrow) is seen in the +PK lanes. Note in Fig. 2A and C the low kd smears with 4M urea treatment + PK (lanes 8) that contrasts to the standard banding pattern seen in urea before PK (lanes 7); the typical PrP pattern and the 17 kd PrP-res reappear when urea is removed from the pellet (lanes 11 and 12). Even more robust PrP-res band restoration is seen when 1M ThU + β-ME is removed from the pellet (lane 18). Multiple preparations showed highly reproducible %PrP in treatments (see , SEMs).
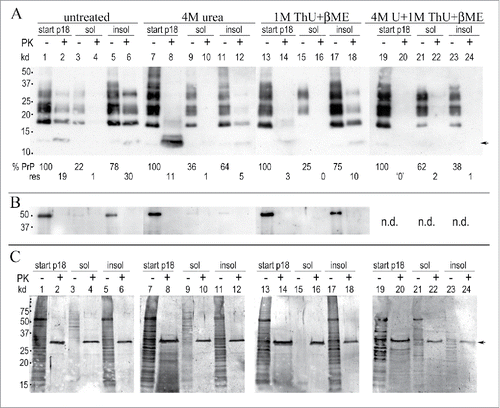
Figure 2. Urea and thiourea (ThU) effects after 1 hr at 22°C on p18 proteins. (A): Representative Western blot shows residual PrP/PrP-res in the p18 (here taken as “100%” for simplicity) with the % of the p18 solubilized (sol) and the % of the p18 that pellets (insol) after chemical treatment. Buffer treated control particles (labeled untreated) are shown in lanes 1-6; 4M urea in lanes 7-12, 1M thiourea (ThU) + 5% β-ME in lanes 13-18, with 4M urea, 1M ThU + 5% β-ME in lanes 19-24. The %PrP and %PrP-res amounts in each p18 partition are shown at the bottom of each lane (- and +PK). Faint standard PrP-res bands of 17-27 kd are present but reproduce poorly in these less exposed films (lanes 4, 10 and 12). (B): Tubulin shows equal loads for each treatment (p18 start lanes); missing tubulin band in lanes 11-12 due to inadequate antibody exposure as evident by its white background vs. the rest of blot. (C): Gold stained proteins. Strong PK band at 29 kd (arrow) is seen in the +PK lanes. Note in Fig. 2A and C the low kd smears with 4M urea treatment + PK (lanes 8) that contrasts to the standard banding pattern seen in urea before PK (lanes 7); the typical PrP pattern and the 17 kd PrP-res reappear when urea is removed from the pellet (lanes 11 and 12). Even more robust PrP-res band restoration is seen when 1M ThU + β-ME is removed from the pellet (lane 18). Multiple preparations showed highly reproducible %PrP in treatments (see Fig. 3A, SEMs).

Figure 3. Western blot PrP quantitation and infectivity (TCID) determinations for FU-CJD based on 3-6 independent p18 preparations for each treatment, including SEMs. Top panel shows analysis of % PrP partitioning in the insol pellet and in the solubilized supernatant after treatments (A): Untreated PrP reference buffer control where the starting p18 PrP is plotted as 100% with the insol component (medium gray bars), and solubilized PrP (black bars); (B): increasing urea concentrations as indicated; (C): β-ME alone, and β-ME + urea; (D): ThU and/or in combination with urea + β-ME. The %PrP-res component of each partition is shown in adjacent hatched bars for each fraction. Bottom panel shows infectivity per gram (e9 CE) of the total p18 controls and the total p18 titer after chemical treatments. The TCID in the control p18 before and after washing was the same () and thus is shown only once as a control (lightest gray bar) in panel A. In the treatment panels B to D, increasing shades of gray to black are used to show increasing chemical concentrations and/or additional components. 2M urea produces no significant decrease in titer, whereas 4M urea significantly decreases titer (*), with further significant decreases** in 6M urea. Addition of β-ME to 6M urea shows no significant titer difference (p=0.5 logs). However, a dramatic loss of infectivity (>4 logs) is induced by the combination of 4M urea, ThU + β-ME, even though 43% of PrP remains aggregated and insoluble (top panel D).
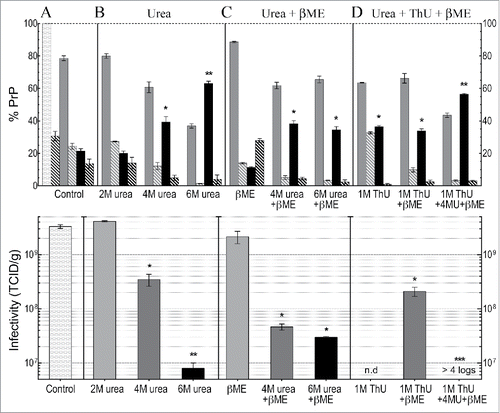
Figure 3. Western blot PrP quantitation and infectivity (TCID) determinations for FU-CJD based on 3-6 independent p18 preparations for each treatment, including SEMs. Top panel shows analysis of % PrP partitioning in the insol pellet and in the solubilized supernatant after treatments (A): Untreated PrP reference buffer control where the starting p18 PrP is plotted as 100% with the insol component (medium gray bars), and solubilized PrP (black bars); (B): increasing urea concentrations as indicated; (C): β-ME alone, and β-ME + urea; (D): ThU and/or in combination with urea + β-ME. The %PrP-res component of each partition is shown in adjacent hatched bars for each fraction. Bottom panel shows infectivity per gram (e9 CE) of the total p18 controls and the total p18 titer after chemical treatments. The TCID in the control p18 before and after washing was the same (Table 1) and thus is shown only once as a control (lightest gray bar) in panel A. In the treatment panels B to D, increasing shades of gray to black are used to show increasing chemical concentrations and/or additional components. 2M urea produces no significant decrease in titer, whereas 4M urea significantly decreases titer (*), with further significant decreases** in 6M urea. Addition of β-ME to 6M urea shows no significant titer difference (p=0.5 logs). However, a dramatic loss of infectivity (>4 logs) is induced by the combination of 4M urea, ThU + β-ME, even though 43% of PrP remains aggregated and insoluble (top panel D).

Table 1. Sequential subcellular fractionation and purification of FU-CJD infectious neuronal cell (GT1) particles from total starting whole cell lysate (100%). Recoveries of different molecular components in each fraction is shown with (A) % infectivity, (B) % protein, (C) % PrP and its PrP-res component (PrP/PrP-res) and (D) nucleic acids. The PrP-res component is calculated as follows: 0.3x denotes that 30% of PrP in that fraction is in the PK resistant PrP-res form. Note the marked reductions in all the different molecular components in the highly infectious p18 particles. Multiple independent cell preparations and infectious titers (TCID) varied by < 3-fold in >30 preparations assayed by duplicate serial dilutions and both the p18 and the p18 buffer washed particles consistently contained an average of 3e9 TCID/gm/e9 cells. Although PrP was reduced, no infectivity was lost by washing (n=27). Protein and PrP/PrP-res amounts are an average of >30 preparations.

Figure 4. (A) shows PrP solubilization in 22L scrapie infected p18 particles, and (B) shows the corresponding TCID/gm after treatment with the denaturants indicated. The light gray bar is the residual p18 particle PrP (taken as 100%) and the black bars show the PrP solubilized by buffer control, and after parallel chemical denaturants. As much as 65% of PrP remains insoluble (medium gray bars) with treatments that induce the greatest >4 log loss of titer, e.g., with 6M urea + β-ME and with the 3 chemical combination of ThU, Urea + β-ME. The 22L scrapie agent is clearly more sensitive than the FU-CJD agent to destruction by 4M urea, and the 22L agent titer is also undetectable after 6M urea + βME, unlike FU-CJD. All p-values <0.05 (including * compared with **).
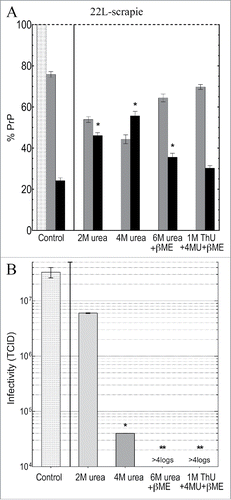
Figure 4. (A) shows PrP solubilization in 22L scrapie infected p18 particles, and (B) shows the corresponding TCID/gm after treatment with the denaturants indicated. The light gray bar is the residual p18 particle PrP (taken as 100%) and the black bars show the PrP solubilized by buffer control, and after parallel chemical denaturants. As much as 65% of PrP remains insoluble (medium gray bars) with treatments that induce the greatest >4 log loss of titer, e.g., with 6M urea + β-ME and with the 3 chemical combination of ThU, Urea + β-ME. The 22L scrapie agent is clearly more sensitive than the FU-CJD agent to destruction by 4M urea, and the 22L agent titer is also undetectable after 6M urea + βME, unlike FU-CJD. All p-values <0.05 (including * compared with **).

Figure 5. Detergent and GdnHCl treatments for 5 min at 22°C of FU-CJD p18 particles. Column A graphs the % of PrP solubilized at indicated detergent concentrations where the sol partition is shown by triangles with solid line and the insol % on the dotted line. Both components added to 100% PrP (black circles). Column B plots TCID of untreated control (white bar) and after indicated treatments. As little as 0.2% SDS without heat reduced p18 TCID by ~1 log, whereas 0.2% sarkosyl treatment, which also solubilizes most PrP, retains all infectivity. At 2M GdnHCl there is a 2 log decrease in titer, while 3M and 4M GdnHCl treatments caused >5 log reductions. SEM shown with all p-values <0.05 (*).
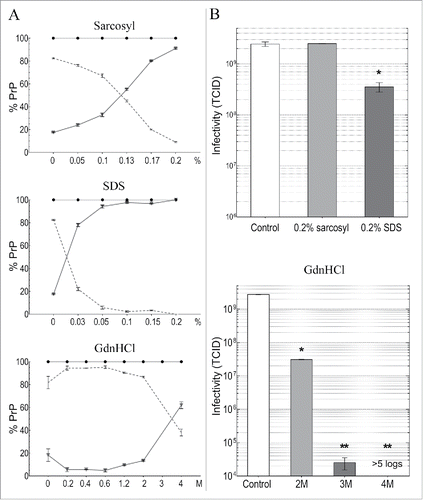
Figure 5. Detergent and GdnHCl treatments for 5 min at 22°C of FU-CJD p18 particles. Column A graphs the % of PrP solubilized at indicated detergent concentrations where the sol partition is shown by triangles with solid line and the insol % on the dotted line. Both components added to 100% PrP (black circles). Column B plots TCID of untreated control (white bar) and after indicated treatments. As little as 0.2% SDS without heat reduced p18 TCID by ~1 log, whereas 0.2% sarkosyl treatment, which also solubilizes most PrP, retains all infectivity. At 2M GdnHCl there is a 2 log decrease in titer, while 3M and 4M GdnHCl treatments caused >5 log reductions. SEM shown with all p-values <0.05 (*).

Figure 6. Representative TCID Western blot assays for FU-CJD where only a TSE infectious agent, but not PrP-res amyloid of cured cells, can provoke progressively increasing PrP-res. (A): Duplicates of control untreated FU-CJD and 2M and 6M urea treated samples inoculated on indicator cells and then passaged. Assay cell passage 5 shows the mock uninfected sample (PK+ lane 2), elicits no PrP-res response. In contrast, the infected FU-CJD p18 control (PK+ lanes 4 and 6) shows a strong response, with 100% of the TCID. The 2M urea treated p18 samples (PK+ lanes 8 and 10) also shows a strong PrP-res response, equivalent to 94% of the TCID of the buffer treated FU-CJD control. In comparison, 6M urea treated samples (PK+ lanes 12 and 14) show only a small PrP-res response that was insufficient for quantitating TCID at this passage (nd). (B): FU-CJD control and 2M, 3M and 4M GdnHCl treated p18 particles at assay passage 4. GdnHCl at 2M was effective at markedly reducing infectivity (PK+ lanes 8 and10) while 3M and 4M GdnHCl reductions were even more pronounced. Even by passage 15 no PrP-res was detectable after 4M GdnHCl treatment of particles, demonstrating a >5 log titer loss. Mock uninfected cells again induced no PrP-res signal (PK+ lane 2). Markers in kd.
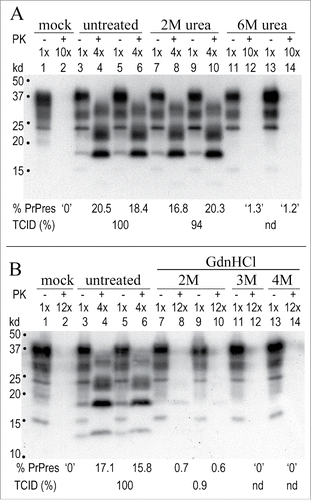
Figure 6. Representative TCID Western blot assays for FU-CJD where only a TSE infectious agent, but not PrP-res amyloid of cured cells, can provoke progressively increasing PrP-res. (A): Duplicates of control untreated FU-CJD and 2M and 6M urea treated samples inoculated on indicator cells and then passaged. Assay cell passage 5 shows the mock uninfected sample (PK+ lane 2), elicits no PrP-res response. In contrast, the infected FU-CJD p18 control (PK+ lanes 4 and 6) shows a strong response, with 100% of the TCID. The 2M urea treated p18 samples (PK+ lanes 8 and 10) also shows a strong PrP-res response, equivalent to 94% of the TCID of the buffer treated FU-CJD control. In comparison, 6M urea treated samples (PK+ lanes 12 and 14) show only a small PrP-res response that was insufficient for quantitating TCID at this passage (nd). (B): FU-CJD control and 2M, 3M and 4M GdnHCl treated p18 particles at assay passage 4. GdnHCl at 2M was effective at markedly reducing infectivity (PK+ lanes 8 and10) while 3M and 4M GdnHCl reductions were even more pronounced. Even by passage 15 no PrP-res was detectable after 4M GdnHCl treatment of particles, demonstrating a >5 log titer loss. Mock uninfected cells again induced no PrP-res signal (PK+ lane 2). Markers in kd.

Reprints and Corporate Permissions

Please note: Selecting permissions does not provide access to the full text of the article, please see our help page How do I view content?

To request a reprint or corporate permissions for this article, please click on the relevant link below:

Academic Permissions

Please note: Selecting permissions does not provide access to the full text of the article, please see our help page How do I view content?

Obtain permissions instantly via Rightslink by clicking on the button below:

If you are unable to obtain permissions via Rightslink, please complete and submit this Permissions form. For more information, please visit our Permissions help page.