783
Views
9
CrossRef citations to date
0
Altmetric
Research Paper

Human parvovirus B19 VP1u Protein as inflammatory mediators induces liver injury in naïve mice

, , , , , & show all
Pages 110-118 | Received 08 Jun 2015, Accepted 14 Nov 2015, Published online: 13 Jan 2016

Figures & data

Figure 1. Detection of FP650 and FP650-VP1u by Western Blots and IVIS, and activity of MMP-9 and MMP-2. (A) Expression of FP650 and FP650-VP1u recombinant proteins in COS-7 cells, COS-7 cells transfected with pTurboFP650 or pTurboFP650-VP1u were detected by Western Blots. (B) Fluorescence detection for BALB/c mice subcutaneously receiving COS-7 cells, COS-7 cells transfected with pTurboFP650, or COS-7 cells transfected with pTurboFP650-VP1u was performed with IVIS systems. (C) The MMP-9 and MMP-2 activity were analyzed by gel zymography after the treatments. Densitometric analysis results are shown in the lower panel. Similar results were observed in 3 independent experiments, and * indicates the significant difference, P < 0.05.
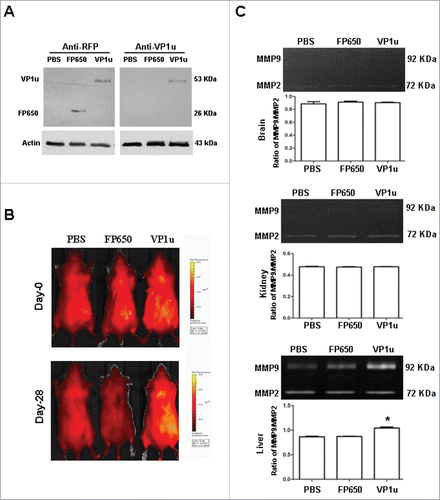
Figure 1. Detection of FP650 and FP650-VP1u by Western Blots and IVIS, and activity of MMP-9 and MMP-2. (A) Expression of FP650 and FP650-VP1u recombinant proteins in COS-7 cells, COS-7 cells transfected with pTurboFP650 or pTurboFP650-VP1u were detected by Western Blots. (B) Fluorescence detection for BALB/c mice subcutaneously receiving COS-7 cells, COS-7 cells transfected with pTurboFP650, or COS-7 cells transfected with pTurboFP650-VP1u was performed with IVIS systems. (C) The MMP-9 and MMP-2 activity were analyzed by gel zymography after the treatments. Densitometric analysis results are shown in the lower panel. Similar results were observed in 3 independent experiments, and * indicates the significant difference, P < 0.05.

Figure 2. Histopathological analysis of hepatic tissue sections with hematoxylin and eosin staining. Livers from BALB/c mice receiving COS-7 cells without tranfection, COS-7 cells transfected with pTurboFP650, and COS-7 cells transfected with pTurboFP650-VP1u are shown were analyzed with hematoxylin and eosin staining. These images of hepatic sections were magnified by 200 times. Amplified images were shown in the right panel and the lymphocyte infiltration was indicated by an arrow. Similar results were observed in 3 independent experiments.
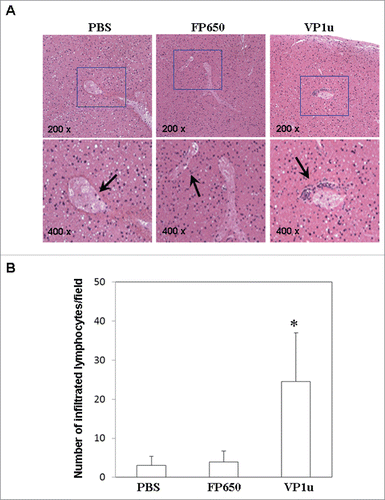
Figure 2. Histopathological analysis of hepatic tissue sections with hematoxylin and eosin staining. Livers from BALB/c mice receiving COS-7 cells without tranfection, COS-7 cells transfected with pTurboFP650, and COS-7 cells transfected with pTurboFP650-VP1u are shown were analyzed with hematoxylin and eosin staining. These images of hepatic sections were magnified by 200 times. Amplified images were shown in the right panel and the lymphocyte infiltration was indicated by an arrow. Similar results were observed in 3 independent experiments.

Figure 3. Expression of CRP, IL1-β and IL-6. Liver lysates obtained from BALB/c mice receiving COS-7 cells without tranfection, COS-7 cells transfected with pTurboFP650, and COS-7 cells transfected with pTurboFP650-VP1u are shown after the treatments were probed with antibodies against (A) CRP, (B) IL1-β and (C) IL-6. Bars represent the relative protein quantification on the basis of actin. Similar results were observed in 3 independent experiments, and * indicates the significant difference, P < 0.05.
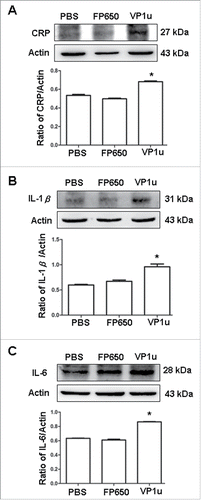
Figure 3. Expression of CRP, IL1-β and IL-6. Liver lysates obtained from BALB/c mice receiving COS-7 cells without tranfection, COS-7 cells transfected with pTurboFP650, and COS-7 cells transfected with pTurboFP650-VP1u are shown after the treatments were probed with antibodies against (A) CRP, (B) IL1-β and (C) IL-6. Bars represent the relative protein quantification on the basis of actin. Similar results were observed in 3 independent experiments, and * indicates the significant difference, P < 0.05.
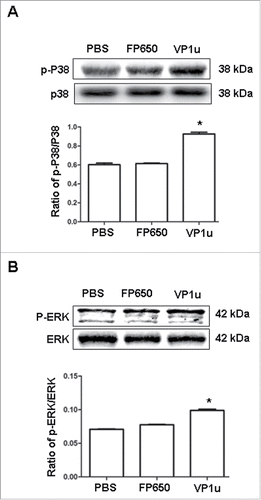
Figure 4. Expression of p-P38, P38, p-ERK, and ERK. Liver lysates obtained from BALB/c mice receiving COS-7 cells without tranfection, COS-7 cells transfected with pTurboFP650, and COS-7 cells transfected with pTurboFP650-VP1u are shown after the treatments were probed with antibodies against (A) p-P38 and P38, (B) p-ERK and ERK. The ratios of p-P38/P38 and p-ERK/ERK were shown in the lower panel, respectively. Similar results were observed in 3 independent experiments, and * indicates the significant difference, P < 0.05.
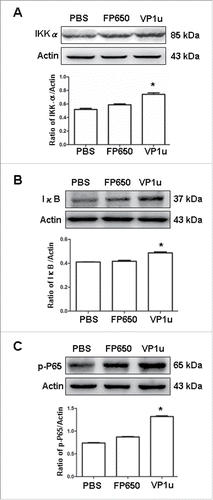
Figure 4. Expression of p-P38, P38, p-ERK, and ERK. Liver lysates obtained from BALB/c mice receiving COS-7 cells without tranfection, COS-7 cells transfected with pTurboFP650, and COS-7 cells transfected with pTurboFP650-VP1u are shown after the treatments were probed with antibodies against (A) p-P38 and P38, (B) p-ERK and ERK. The ratios of p-P38/P38 and p-ERK/ERK were shown in the lower panel, respectively. Similar results were observed in 3 independent experiments, and * indicates the significant difference, P < 0.05.
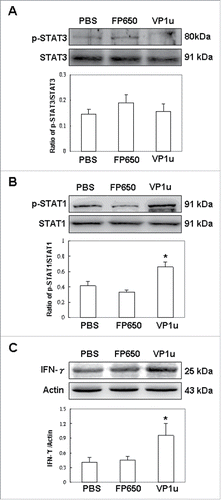
Figure 5. Expression of IKK-α, IκB, and p-P65. Liver lysates obtained from BALB/c mice receiving COS-7 cells without tranfection, COS-7 cells transfected with pTurboFP650, and COS-7 cells transfected with pTurboFP650-VP1u are shown after the treatments were probed with antibodies against (A) IKK-α, (B) IκB, and (C) p-P65. Bars represent the relative protein quantification on the basis of actin. Similar results were observed in 3 independent experiments, and * indicates the significant difference, P < 0.05.

Figure 5. Expression of IKK-α, IκB, and p-P65. Liver lysates obtained from BALB/c mice receiving COS-7 cells without tranfection, COS-7 cells transfected with pTurboFP650, and COS-7 cells transfected with pTurboFP650-VP1u are shown after the treatments were probed with antibodies against (A) IKK-α, (B) IκB, and (C) p-P65. Bars represent the relative protein quantification on the basis of actin. Similar results were observed in 3 independent experiments, and * indicates the significant difference, P < 0.05.

Figure 6. Expression of p-STAT3, STAT3, p-STAT1, STAT1 and IFN-γ. Liver lysates obtained from BALB/c mice receiving COS-7 cells without tranfection, COS-7 cells transfected with pTurboFP650, and COS-7 cells transfected with pTurboFP650-VP1u are shown after the treatments were probed with antibodies against (A) p-STAT3 and STAT3, (B) p-STAT1 and STAT1, and (C) IFN-γ. The ratios of p-STAT3/STAT3, p-STAT1/STAT1 and IFN-γ/actin were shown in the lower panel, respectively. Similar results were observed in 3 independent experiments, and * indicates the significant difference, P < 0.05.

Figure 6. Expression of p-STAT3, STAT3, p-STAT1, STAT1 and IFN-γ. Liver lysates obtained from BALB/c mice receiving COS-7 cells without tranfection, COS-7 cells transfected with pTurboFP650, and COS-7 cells transfected with pTurboFP650-VP1u are shown after the treatments were probed with antibodies against (A) p-STAT3 and STAT3, (B) p-STAT1 and STAT1, and (C) IFN-γ. The ratios of p-STAT3/STAT3, p-STAT1/STAT1 and IFN-γ/actin were shown in the lower panel, respectively. Similar results were observed in 3 independent experiments, and * indicates the significant difference, P < 0.05.
Supplemental material

KVIR_A_1122165_Supp.zip

Download Zip (2.7 MB)

Reprints and Corporate Permissions

Please note: Selecting permissions does not provide access to the full text of the article, please see our help page How do I view content?

To request a reprint or corporate permissions for this article, please click on the relevant link below:

Academic Permissions

Please note: Selecting permissions does not provide access to the full text of the article, please see our help page How do I view content?

Obtain permissions instantly via Rightslink by clicking on the button below:

If you are unable to obtain permissions via Rightslink, please complete and submit this Permissions form. For more information, please visit our Permissions help page.