946
Views
14
CrossRef citations to date
0
Altmetric
Research Paper

The killing of macrophages by Corynebacterium ulcerans

, , , , , & show all
Pages 45-55 | Received 16 Oct 2015, Accepted 20 Nov 2015, Published online: 29 Dec 2015

Figures & data

Figure 1. Fluorescence microscopy of C. ulcerans and THP-1 cells. THP-1 cells were infected with C. glutamicum ATCC 13032 pEPR1p45gfp, C. ulcerans 809 pEPR1p45gfp and C. ulcerans BR-AD22 pEPR1p45gfp at an MOI of 10 for 30 min. Extracellular bacteria were killed by the addition of gentamicin and after different time points, cells were fixed. Nuclei were stained with DAPI, the cytoskeleton with Alexa Fluor® 647 Phalloidin and z-stack micrographs were taken using the confocal laser-scanning microscope Leica SP5 II and analyzed with the LAS software suite to proof that bacteria are located inside of the macrophages. Representative pictures are shown.
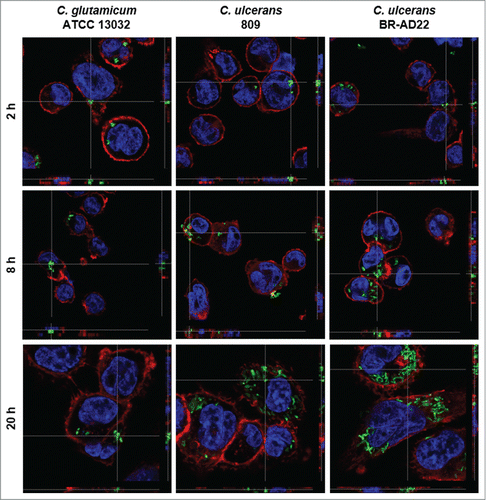
Figure 1. Fluorescence microscopy of C. ulcerans and THP-1 cells. THP-1 cells were infected with C. glutamicum ATCC 13032 pEPR1p45gfp, C. ulcerans 809 pEPR1p45gfp and C. ulcerans BR-AD22 pEPR1p45gfp at an MOI of 10 for 30 min. Extracellular bacteria were killed by the addition of gentamicin and after different time points, cells were fixed. Nuclei were stained with DAPI, the cytoskeleton with Alexa Fluor® 647 Phalloidin and z-stack micrographs were taken using the confocal laser-scanning microscope Leica SP5 II and analyzed with the LAS software suite to proof that bacteria are located inside of the macrophages. Representative pictures are shown.

Figure 2. Quantitative analysis of viable intracellular C. ulcerans in THP-1 cells. THP-1 cells were infected with C. ulcerans wild type strains 809 and BR-AD22 at an MOI of 1 for 30 min. To kill extracellular bacteria, cells were incubated with medium containing gentamicin and after 2 (white bars), 8 (gray bars) and 20 h (black bars), cells were harvested, lysed and lysates were plated on blood agar plates to recover intracellular CFU. A) Intracellular CFU in percent referred to the inoculum, B) intracellular survival in percent referred to the bacteria that were taken up after 2 h. Data shown are mean values of 4 independent biological replicates each performed in triplicates ± standard deviation.
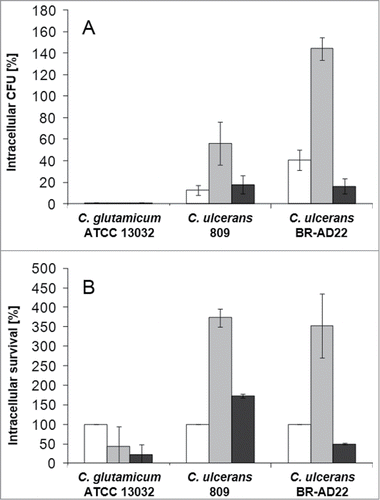
Figure 2. Quantitative analysis of viable intracellular C. ulcerans in THP-1 cells. THP-1 cells were infected with C. ulcerans wild type strains 809 and BR-AD22 at an MOI of 1 for 30 min. To kill extracellular bacteria, cells were incubated with medium containing gentamicin and after 2 (white bars), 8 (gray bars) and 20 h (black bars), cells were harvested, lysed and lysates were plated on blood agar plates to recover intracellular CFU. A) Intracellular CFU in percent referred to the inoculum, B) intracellular survival in percent referred to the bacteria that were taken up after 2 h. Data shown are mean values of 4 independent biological replicates each performed in triplicates ± standard deviation.

Figure 3. Labeling and tracking of acidic organelles in THP-1 cells infected with C. ulcerans. THP-1 cells were incubated with LysoTracker® Red DND-99 for 120 min before cells were infected with C. glutamicum ATCC 13032 pEPR1p45gfp, C. ulcerans 809 pEPR1p45gfp and C. ulcerans BR-AD22 pEPR1p45gfp at an MOI of 10 for 30 min. Extracellular bacteria were killed by the addition of gentamicin and after 2, 8 and 20 h, cells were fixed. Nuclei were stained with DAPI, the cytoskeleton with Alexa Fluor® 647 Phalloidin and micrographs were taken using the confocal laser-scanning microscope Leica SP5 II and analyzed with the LAS software suite. Non-pathogenic C. glutamicum immediately co-localize with acidic compartments (2 h) whereas pathogenic C. ulcerans only show co-localization after longer incubation time (8 h to 20 h). Representative pictures are shown. Scale bars: 10 µm.
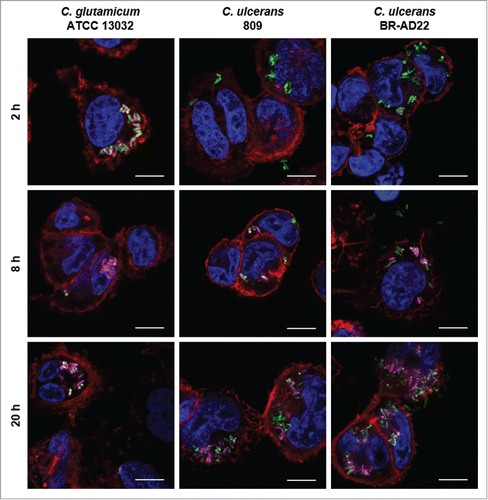
Figure 3. Labeling and tracking of acidic organelles in THP-1 cells infected with C. ulcerans. THP-1 cells were incubated with LysoTracker® Red DND-99 for 120 min before cells were infected with C. glutamicum ATCC 13032 pEPR1p45gfp, C. ulcerans 809 pEPR1p45gfp and C. ulcerans BR-AD22 pEPR1p45gfp at an MOI of 10 for 30 min. Extracellular bacteria were killed by the addition of gentamicin and after 2, 8 and 20 h, cells were fixed. Nuclei were stained with DAPI, the cytoskeleton with Alexa Fluor® 647 Phalloidin and micrographs were taken using the confocal laser-scanning microscope Leica SP5 II and analyzed with the LAS software suite. Non-pathogenic C. glutamicum immediately co-localize with acidic compartments (2 h) whereas pathogenic C. ulcerans only show co-localization after longer incubation time (8 h to 20 h). Representative pictures are shown. Scale bars: 10 µm.

Table 1. Automated analysis of co-localization of bacteria with acidic compartments. At least 19 fluorescence microscopy pictures were analyzed for each data set as described in the Materials and Methods section.

Table 2. Strains, cell lines and plasmids used in this study.

Figure 4. NF-κB activation in THP1-Blue™ NF-κB reporter cells after C. ulcerans infection. THP1-Blue™ NF-κB cells were incubated for 20 h with (A) viable and (B) UV-killed bacteria of the non-pathogenic C. glutamicum ATCC 13032 and pathogenic C. ulcerans strains 809 and BR-AD22 at an MOI of 1 (white bars), 10 (gray bars) and 100 (black bars). For viable C. ulcerans, MOI 100 led to detrimental effects on cells and data are not shown. Subsequently, supernatants were taken and mixed with QuantiBlue SEAP detection solution leading to a change in color upon NF-κB activation. Living C. glutamicum led to high SEAP levels in all MOIs, whereas living C. ulcerans showed lower levels at higher MOIs. Infection with dead bacteria led to a dose-dependent NF-κB activation in all cases. Data shown are mean values of 3 independent biological replicates each performed in triplicates ± standard deviation.
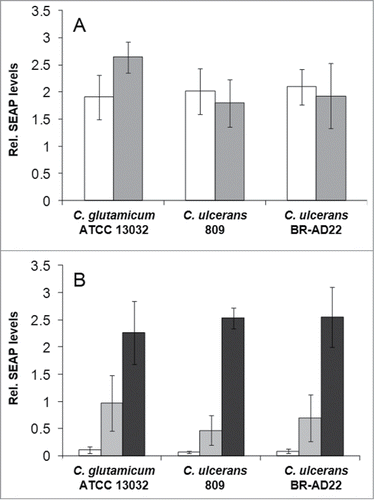
Figure 4. NF-κB activation in THP1-Blue™ NF-κB reporter cells after C. ulcerans infection. THP1-Blue™ NF-κB cells were incubated for 20 h with (A) viable and (B) UV-killed bacteria of the non-pathogenic C. glutamicum ATCC 13032 and pathogenic C. ulcerans strains 809 and BR-AD22 at an MOI of 1 (white bars), 10 (gray bars) and 100 (black bars). For viable C. ulcerans, MOI 100 led to detrimental effects on cells and data are not shown. Subsequently, supernatants were taken and mixed with QuantiBlue SEAP detection solution leading to a change in color upon NF-κB activation. Living C. glutamicum led to high SEAP levels in all MOIs, whereas living C. ulcerans showed lower levels at higher MOIs. Infection with dead bacteria led to a dose-dependent NF-κB activation in all cases. Data shown are mean values of 3 independent biological replicates each performed in triplicates ± standard deviation.
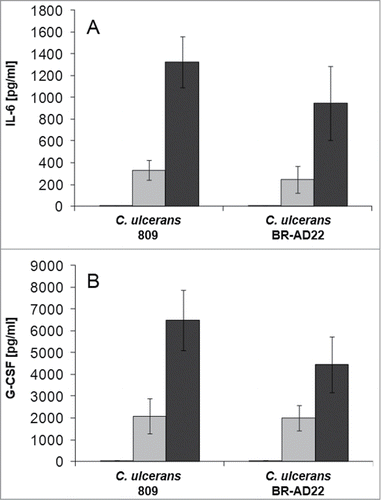
Figure 5. Cytokine ELISA of THP-1 cells after infection with C. ulcerans. Supernatants of THP-1 cells infected with C. ulcerans were collected at 2 (white bars), 8 (gray bars) and 20 h (black bars) post-infection and used as samples for determination of (A) IL-6 and (B) G-CSF concentrations. Data shown are mean values of 3 independent biological replicates each performed in triplicates ± standard deviation.

Figure 5. Cytokine ELISA of THP-1 cells after infection with C. ulcerans. Supernatants of THP-1 cells infected with C. ulcerans were collected at 2 (white bars), 8 (gray bars) and 20 h (black bars) post-infection and used as samples for determination of (A) IL-6 and (B) G-CSF concentrations. Data shown are mean values of 3 independent biological replicates each performed in triplicates ± standard deviation.

Figure 6. Detachment of THP-1 cells infected with C. ulcerans. Cells infected with non-pathogenic C. glutamicum or pathogenic C. ulcerans at an MOI of 10 and 1 were analyzed microscopically at 2, 8 and 20 h post-infection, untreated cells served as negative control. Both C. ulcerans wild type strains caused detachment of cells at MOI 10 after 8 h, and an increasing effect with longer incubation time. Cells treated with C. glutamicum looked healthy even after 20 h, as well as cells incubated with a lower amount of bacteria (MOI 1).
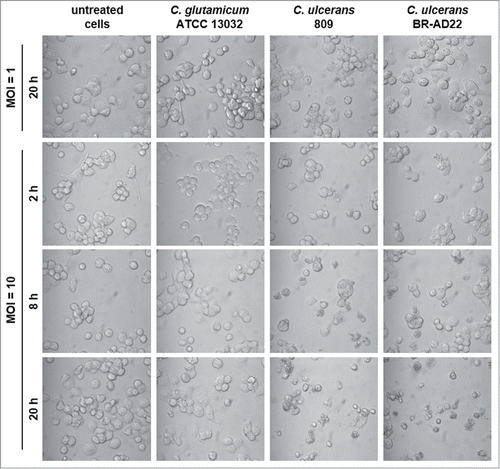
Figure 6. Detachment of THP-1 cells infected with C. ulcerans. Cells infected with non-pathogenic C. glutamicum or pathogenic C. ulcerans at an MOI of 10 and 1 were analyzed microscopically at 2, 8 and 20 h post-infection, untreated cells served as negative control. Both C. ulcerans wild type strains caused detachment of cells at MOI 10 after 8 h, and an increasing effect with longer incubation time. Cells treated with C. glutamicum looked healthy even after 20 h, as well as cells incubated with a lower amount of bacteria (MOI 1).

Figure 7. 7-AAD staining and FACS analysis of THP-1 cells infected with C. ulcerans. THP-1 cells were infected with the non-pathogenic C. glutamicum ATCC 13032 and pathogenic C. ulcerans strains 809 and BR-AD22 at MOI 50, uninfected cells were carried along as negative control. After different points in time, cells were harvested and stained with 7-AAD, a dye that only penetrates dead cells, and analyzed by flow cytometry. (A) Dot plots of representative samples show forward scatter versus side scatter. Gate A excludes cell debris and small fragments like bacteria. (B) Histograms (7-AAD signal vs. cell count) of 10,000 cells after gating. Gate B represents 7-AAD positive, dead cells (light gray in gate A). (C) Quantitative analysis of 7-AAD positive cells at 2 (white bars), 8 (gray bars) and 20 h (black bars). Mean values and standard deviations of at least 2 independent assays performed in triplicate are depicted.
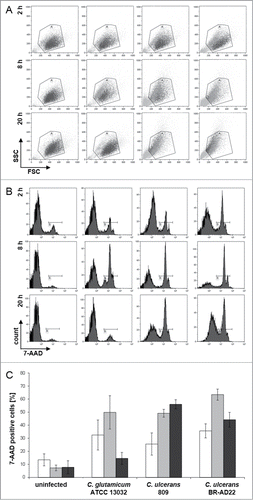
Figure 7. 7-AAD staining and FACS analysis of THP-1 cells infected with C. ulcerans. THP-1 cells were infected with the non-pathogenic C. glutamicum ATCC 13032 and pathogenic C. ulcerans strains 809 and BR-AD22 at MOI 50, uninfected cells were carried along as negative control. After different points in time, cells were harvested and stained with 7-AAD, a dye that only penetrates dead cells, and analyzed by flow cytometry. (A) Dot plots of representative samples show forward scatter versus side scatter. Gate A excludes cell debris and small fragments like bacteria. (B) Histograms (7-AAD signal vs. cell count) of 10,000 cells after gating. Gate B represents 7-AAD positive, dead cells (light gray in gate A). (C) Quantitative analysis of 7-AAD positive cells at 2 (white bars), 8 (gray bars) and 20 h (black bars). Mean values and standard deviations of at least 2 independent assays performed in triplicate are depicted.

Figure 8. LDH release of THP1-Blue cells infected with C. ulcerans. The release of lactate dehydrogenase (LDH) as a sign of host cell damage during infection of THP1-Blue™ NF-κB cells with C. ulcerans was measured using the cytotoxicity detection kit (Roche). (A) Cells were infected for 20 h with the non-pathogenic C. glutamicum ATCC 13032 and pathogenic C. ulcerans wild type strains 809 and BR-AD22 at an MOI of 1 (white bars) and 10 (gray bars). The non-pathogenic C. glutamicum had no damaging effect. However, C. ulcerans led to LDH release at MOI 1 and 10. (B) Cells were infected with C. ulcerans mutant strains ELHA1 and ELHA3 at MOI 1 and the LDH release was compared to the corresponding wild type strain BR-AD22 which was set to 100 %. Data shown are mean values of 3 independent biological replicates each performed in triplicates ± standard deviation.
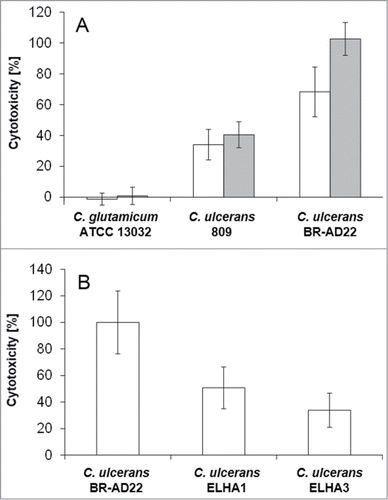
Figure 8. LDH release of THP1-Blue cells infected with C. ulcerans. The release of lactate dehydrogenase (LDH) as a sign of host cell damage during infection of THP1-Blue™ NF-κB cells with C. ulcerans was measured using the cytotoxicity detection kit (Roche). (A) Cells were infected for 20 h with the non-pathogenic C. glutamicum ATCC 13032 and pathogenic C. ulcerans wild type strains 809 and BR-AD22 at an MOI of 1 (white bars) and 10 (gray bars). The non-pathogenic C. glutamicum had no damaging effect. However, C. ulcerans led to LDH release at MOI 1 and 10. (B) Cells were infected with C. ulcerans mutant strains ELHA1 and ELHA3 at MOI 1 and the LDH release was compared to the corresponding wild type strain BR-AD22 which was set to 100 %. Data shown are mean values of 3 independent biological replicates each performed in triplicates ± standard deviation.

Reprints and Corporate Permissions

Please note: Selecting permissions does not provide access to the full text of the article, please see our help page How do I view content?

To request a reprint or corporate permissions for this article, please click on the relevant link below:

Academic Permissions

Please note: Selecting permissions does not provide access to the full text of the article, please see our help page How do I view content?

Obtain permissions instantly via Rightslink by clicking on the button below:

If you are unable to obtain permissions via Rightslink, please complete and submit this Permissions form. For more information, please visit our Permissions help page.