1,977
Views
25
CrossRef citations to date
0
Altmetric
Research Paper

Outer membrane Protein A plays a role in pathogenesis of Acinetobacter nosocomialis

, , , , , , & show all
Pages 413-426 | Received 11 Nov 2015, Accepted 04 Jan 2016, Published online: 22 Feb 2016

Figures & data

Figure 1. Generation of the ΔompA mutant OH1 strain and the ompA complemented OH2 strain. (A) PCR analysis of the genomic DNA of wild-type and ΔompA mutant OH1 strains using OmpA01F and OmpA01R primers. The genomic DNA of A. nosocomialis ATCC 17903T produced a 3.1 kb amplicon (lane 1), whereas the PCR using genomic DNA from the ΔompA mutant OH1 strain resulted in a 2.1 kb amplicon (lane 2). Lane M: 1-kb DNA molecular marker. (B) PCR analysis of the genomic DNA of wild-type, ΔompA mutant OH1, and ompA complemented OH2 strains using the OmpA04F and OmpA04R primers. The full-length ompA gene (expected size of 1,066 bp) was amplified in the wild-type (lane 1) and ompA complemented OH2 strains (lane 3). It was not amplified in the ΔompA mutant OH1 strain (lane 2). Lane M: 1-kb DNA molecular marker. (C) SDS-PAGE analysis and protein gel blot analysis of outer membrane proteins prepared from the wild-type (lane 1), ΔompA mutant OH1 (lane 2), and ompA complemented OH2 (lane 3) strains. Protein samples were separated by SDS-PAGE on a 12% gel, transferred to membranes, and immunoblotted with polyclonal anti-mouse AbOmpA immune serum. In lane M and 4, the molecular marker and recombinant OmpA protein with a molecular weight of 44 kDa were loaded, respectively. Arrows indicate the 37.4 kDa OmpA proteins. (D) Bacterial growth curve of A. nosocomialis strains cultured in LB broth under static conditions at 37°C for 48 h. CFUs were determined at the indicated time points. The data are the mean CFUs of duplicate in a representative of three independent experiments.
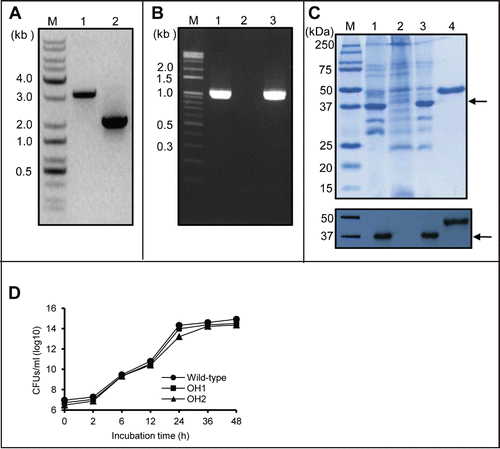
Figure 1. Generation of the ΔompA mutant OH1 strain and the ompA complemented OH2 strain. (A) PCR analysis of the genomic DNA of wild-type and ΔompA mutant OH1 strains using OmpA01F and OmpA01R primers. The genomic DNA of A. nosocomialis ATCC 17903T produced a 3.1 kb amplicon (lane 1), whereas the PCR using genomic DNA from the ΔompA mutant OH1 strain resulted in a 2.1 kb amplicon (lane 2). Lane M: 1-kb DNA molecular marker. (B) PCR analysis of the genomic DNA of wild-type, ΔompA mutant OH1, and ompA complemented OH2 strains using the OmpA04F and OmpA04R primers. The full-length ompA gene (expected size of 1,066 bp) was amplified in the wild-type (lane 1) and ompA complemented OH2 strains (lane 3). It was not amplified in the ΔompA mutant OH1 strain (lane 2). Lane M: 1-kb DNA molecular marker. (C) SDS-PAGE analysis and protein gel blot analysis of outer membrane proteins prepared from the wild-type (lane 1), ΔompA mutant OH1 (lane 2), and ompA complemented OH2 (lane 3) strains. Protein samples were separated by SDS-PAGE on a 12% gel, transferred to membranes, and immunoblotted with polyclonal anti-mouse AbOmpA immune serum. In lane M and 4, the molecular marker and recombinant OmpA protein with a molecular weight of 44 kDa were loaded, respectively. Arrows indicate the 37.4 kDa OmpA proteins. (D) Bacterial growth curve of A. nosocomialis strains cultured in LB broth under static conditions at 37°C for 48 h. CFUs were determined at the indicated time points. The data are the mean CFUs of duplicate in a representative of three independent experiments.

Table 1. Oligonucleotides used in this study.

Table 2. Bacterial strains and plasmids used in this study.

Figure 2. Biofilm formation of A. nosocomialis strains. (A) Bacteria were cultured in polystyrene tubes at 30°C for 14 h, 24 h, and 48 h. Biofilm formation was quantified by calculating the ratio of A570/A600. (B) SEM analysis of bacterial biofilms formed on the plastic surfaces at 14 h. Means ± standard deviation were calculated based on the results of three independent experiments. Wild-type, A. nosocomialis ATCC 17903T; OH1, ΔompA mutant; OH2, ompA complemented strain. *,P < 0.05; **,P < 0.01.
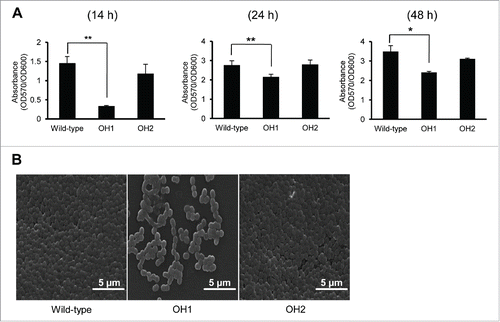
Figure 2. Biofilm formation of A. nosocomialis strains. (A) Bacteria were cultured in polystyrene tubes at 30°C for 14 h, 24 h, and 48 h. Biofilm formation was quantified by calculating the ratio of A570/A600. (B) SEM analysis of bacterial biofilms formed on the plastic surfaces at 14 h. Means ± standard deviation were calculated based on the results of three independent experiments. Wild-type, A. nosocomialis ATCC 17903T; OH1, ΔompA mutant; OH2, ompA complemented strain. *,P < 0.05; **,P < 0.01.

Figure 3. Adherence of A. nosocomialis strains to A549 cells. (A) Cells were infected with A. nosocomialis at an MOI of 100 for 1 h and stained with Giemsa solution. Magnification: 100 ×. (B and C) A549 cells were infected with A. nosocomialis at an MOI of 100 for 1 h, and the percentage of infected cells (B) and cell-associated bacteria per 90 cells (C) were counted. The adherence data are expressed as mean ± standard deviation based on two independent experiments, each performed in triplicate. *,P < 0.05.
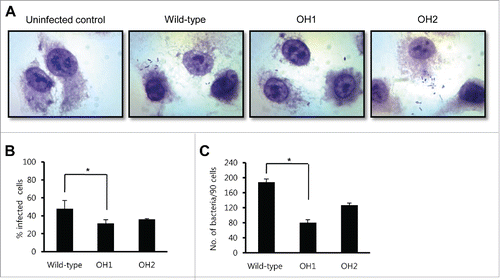
Figure 3. Adherence of A. nosocomialis strains to A549 cells. (A) Cells were infected with A. nosocomialis at an MOI of 100 for 1 h and stained with Giemsa solution. Magnification: 100 ×. (B and C) A549 cells were infected with A. nosocomialis at an MOI of 100 for 1 h, and the percentage of infected cells (B) and cell-associated bacteria per 90 cells (C) were counted. The adherence data are expressed as mean ± standard deviation based on two independent experiments, each performed in triplicate. *,P < 0.05.

Figure 4. Cytotoxicity of A. nosocomialis infection for epithelial cells. A549 cells were infected with A. nosocomialis strains at an MOI of 100 for 16 h. Cells were stained with propidium iodide. The DNA content of each cell was analyzed using flow cytometry. A total of 9,000 cells were analyzed per sample. The percentage of cells in the hypo-diploid population is indicated in the diagrams. Representative data from three independent experiments are shown.
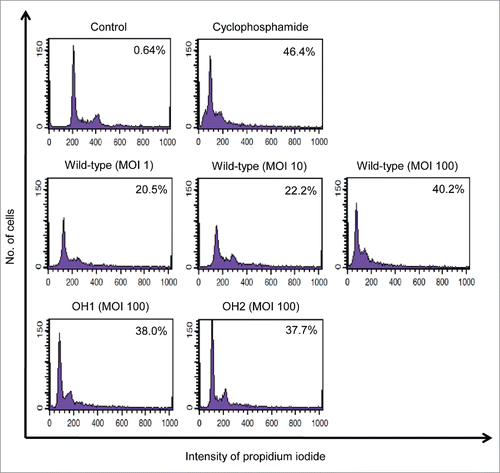
Figure 4. Cytotoxicity of A. nosocomialis infection for epithelial cells. A549 cells were infected with A. nosocomialis strains at an MOI of 100 for 16 h. Cells were stained with propidium iodide. The DNA content of each cell was analyzed using flow cytometry. A total of 9,000 cells were analyzed per sample. The percentage of cells in the hypo-diploid population is indicated in the diagrams. Representative data from three independent experiments are shown.

Figure 5. Purification of A. nosocomialis OMVs and their cytotoxicity in epithelial cells. (A) TEM analysis of OMVs from A. nosocomialis ATCC 17903T, ΔompA mutant OH1 strain, and ompA complemented OH2 strain. (B) SDS-PAGE and western blotting analysis of OMVs from A. nosocomialis strains. Lane 1, bacterial lysate of the wild-type strain; 2, OMVs from the wild-type strain; 3, bacterial lysate of the ΔompA mutant; 4, OMVs from the ΔompA mutant; 5, bacterial lysate of the ompA complemented strain; 6, OMVs from the ompA complemented strain. Arrows indicate the 37.4 kDa OmpA proteins. (C and D) HEp-2 (C) and A549 (D) cells were treated with OMVs from A. nosocomialis strains for 24 h. Cellular viability was determined by a WST-1 assay. The values are expressed as relative fold changes of optical density of cells treated with A. nosocomialis OMVs at A450 compared to those of untreated control cells. Data are presented as the mean ± standard deviation of three independent experiments, each performed in duplicate. *,P <0.05; **,P <0.01.
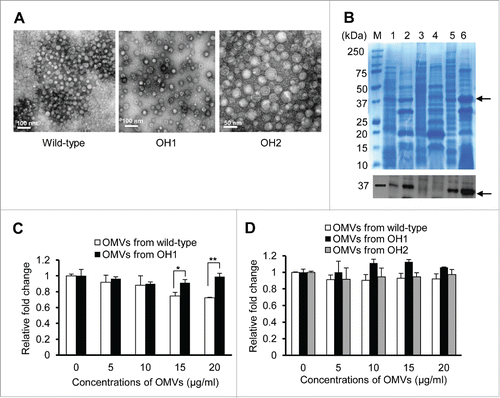
Figure 5. Purification of A. nosocomialis OMVs and their cytotoxicity in epithelial cells. (A) TEM analysis of OMVs from A. nosocomialis ATCC 17903T, ΔompA mutant OH1 strain, and ompA complemented OH2 strain. (B) SDS-PAGE and western blotting analysis of OMVs from A. nosocomialis strains. Lane 1, bacterial lysate of the wild-type strain; 2, OMVs from the wild-type strain; 3, bacterial lysate of the ΔompA mutant; 4, OMVs from the ΔompA mutant; 5, bacterial lysate of the ompA complemented strain; 6, OMVs from the ompA complemented strain. Arrows indicate the 37.4 kDa OmpA proteins. (C and D) HEp-2 (C) and A549 (D) cells were treated with OMVs from A. nosocomialis strains for 24 h. Cellular viability was determined by a WST-1 assay. The values are expressed as relative fold changes of optical density of cells treated with A. nosocomialis OMVs at A450 compared to those of untreated control cells. Data are presented as the mean ± standard deviation of three independent experiments, each performed in duplicate. *,P <0.05; **,P <0.01.

Figure 6. Venn diagram of proteins identified in OMVs from A. nosocomialis ATCC 17903T and ΔompA mutant OH1 strain. The number of proteins identified in the OMVs is presented. A total of 147 and 168 proteins were identified in OMVs from A. nosocomialis ATCC 17903T and the ΔompA mutant, respectively. Eighty-seven proteins were commonly identified in OMVs from both the wild-type strain and the ΔompA mutant.
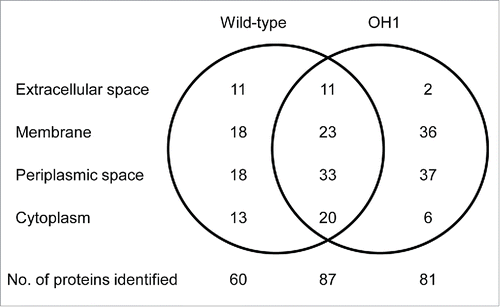
Figure 6. Venn diagram of proteins identified in OMVs from A. nosocomialis ATCC 17903T and ΔompA mutant OH1 strain. The number of proteins identified in the OMVs is presented. A total of 147 and 168 proteins were identified in OMVs from A. nosocomialis ATCC 17903T and the ΔompA mutant, respectively. Eighty-seven proteins were commonly identified in OMVs from both the wild-type strain and the ΔompA mutant.
Supplemental material

KVIR_A_Supp_1140298.xlsx

Download MS Excel (22.9 KB)

Reprints and Corporate Permissions

Please note: Selecting permissions does not provide access to the full text of the article, please see our help page How do I view content?

To request a reprint or corporate permissions for this article, please click on the relevant link below:

Academic Permissions

Please note: Selecting permissions does not provide access to the full text of the article, please see our help page How do I view content?

Obtain permissions instantly via Rightslink by clicking on the button below:

If you are unable to obtain permissions via Rightslink, please complete and submit this Permissions form. For more information, please visit our Permissions help page.