1,914
Views
46
CrossRef citations to date
0
Altmetric
Research Paper

Induction of DNA double-strand breaks and cellular senescence by human respiratory syncytial virus

, , , , , & show all
Pages 427-442 | Received 12 Aug 2015, Accepted 14 Jan 2016, Published online: 11 Mar 2016

Figures & data

Figure 1. Occurrence of cellular senescence in cells infected with HRSV. (A) Occurrence of cellular senescence during HRSV lytic infection of A549 cells seeded at 5200 cells/cm2. The cells were processed for SA-βgal assay at 48 h.p.i. (MOI = 3). Magnification: 200X, scale bar: 50 μm. (B) Quantification of SA-βgal expression in A549 cells (in total population and syncytia). (C) and (D) Similar assays in HEp-2 cells. (E) Immuno-SA-βgal, an assay that allows the detection of SA-βgal expression in massively infected HEp-2 cells stained with α-HRSV antibodies (red staining). Magnification: 200X; scale bar: 50 μm. (F) Occurrence and quantification of cellular senescence in a culture of HEp-2 cells persistently infected by HRSV. Magnification: 200X; scale bar: 50 μm. (G) Quantification of IL-6 and TNF-α in supernatants of cultured cells. Bars in the graphs represent the mean ± SD of 2–3 experiments. n = 3 replicates. (H) Analysis of apoptosis/necrosis. Eight thousand cells/well were plated in 6-well plates and were infected with HRSV the following day at MOI = 3. At 60 h.p.i., the cells were processed for flow cytometry. After treatment with the fluorescent probes (AnnexinV-AlexaFluor488™ and Sytox™) apoptotic cells show green fluorescence, dead cells show brighter green fluorescence, and live cells show little. These populations were distinguished in the FL1 channel of a FACSCalibur flow cytometer. Treatment of cells with 20 μM camptothecin (CPT) for 12 h was used as positive control for apoptosis. (I) SA-βgal assay using the fluorogenic βgalactosidase substrate C12FDG and flow cytometry (upper panel) or conventional SA-βgal (bottom panel). Eight thousand cells/well were plated in 6-well plates and were infected following day with HRSV at MOI = 3. At 60 h.p.i., the cells were incubated with Bafilomycin A1 and C12FDG and processed for flow cytometry or conventional SA-βgal assay (bottom panel) as described in materials and methods. Magnification: 200X; scale bar: 50 μm.
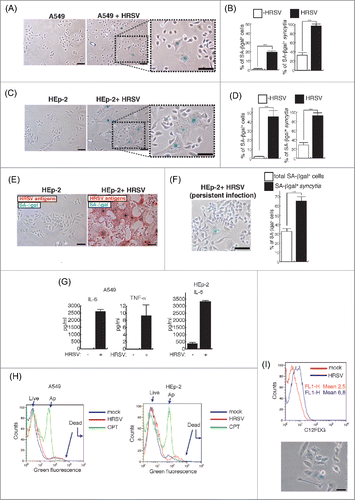
Figure 1. Occurrence of cellular senescence in cells infected with HRSV. (A) Occurrence of cellular senescence during HRSV lytic infection of A549 cells seeded at 5200 cells/cm2. The cells were processed for SA-βgal assay at 48 h.p.i. (MOI = 3). Magnification: 200X, scale bar: 50 μm. (B) Quantification of SA-βgal expression in A549 cells (in total population and syncytia). (C) and (D) Similar assays in HEp-2 cells. (E) Immuno-SA-βgal, an assay that allows the detection of SA-βgal expression in massively infected HEp-2 cells stained with α-HRSV antibodies (red staining). Magnification: 200X; scale bar: 50 μm. (F) Occurrence and quantification of cellular senescence in a culture of HEp-2 cells persistently infected by HRSV. Magnification: 200X; scale bar: 50 μm. (G) Quantification of IL-6 and TNF-α in supernatants of cultured cells. Bars in the graphs represent the mean ± SD of 2–3 experiments. n = 3 replicates. (H) Analysis of apoptosis/necrosis. Eight thousand cells/well were plated in 6-well plates and were infected with HRSV the following day at MOI = 3. At 60 h.p.i., the cells were processed for flow cytometry. After treatment with the fluorescent probes (AnnexinV-AlexaFluor488™ and Sytox™) apoptotic cells show green fluorescence, dead cells show brighter green fluorescence, and live cells show little. These populations were distinguished in the FL1 channel of a FACSCalibur flow cytometer. Treatment of cells with 20 μM camptothecin (CPT) for 12 h was used as positive control for apoptosis. (I) SA-βgal assay using the fluorogenic βgalactosidase substrate C12FDG and flow cytometry (upper panel) or conventional SA-βgal (bottom panel). Eight thousand cells/well were plated in 6-well plates and were infected following day with HRSV at MOI = 3. At 60 h.p.i., the cells were incubated with Bafilomycin A1 and C12FDG and processed for flow cytometry or conventional SA-βgal assay (bottom panel) as described in materials and methods. Magnification: 200X; scale bar: 50 μm.

Figure 2. HRSV induces DNA damage. (A) Analysis of confocal colocalization of the DNA damage markers γH2AFX and TP53BP1 in HRSV-infected A549 cells (48 h.p.i. MOI = 3). Magnification: 600X; scale bar: 10 μm (B) Conventional indirect immunofluorescence showing the presence of γH2AFX and TP53BP1 in mock and infected A549 cells (48 h.p.i. MOI = 3). Magnification: 600X; scale bar: 10 μm. Quantification of the DNA damage foci containing γH2AFX and TP53BP1 is shown at the right panel. (C) Detection by western-blotting of various DNA damage and proliferation arrest markers in mock and infected A549 cells (30 h.p.i. MOI = 3: panels P-TP53, CDKN2A, P-RB1, P-ATM); 48 h.p.i. MOI = 3: panels CDKN1A and γH2FAX. KDa: kilodaltons. Bars in the graphs represent the mean ± SD of 2 experiments, n = 3 replicates. DNA damage foci were counted from >150 cells for each experimental condition. Data from panel c are of a representative experiment.
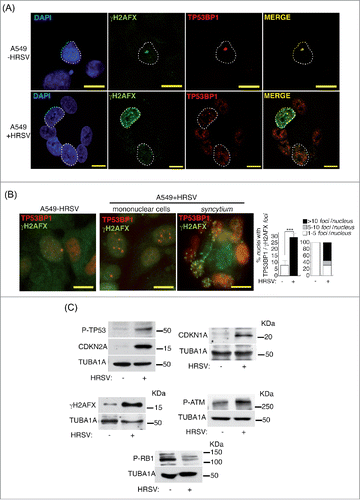
Figure 2. HRSV induces DNA damage. (A) Analysis of confocal colocalization of the DNA damage markers γH2AFX and TP53BP1 in HRSV-infected A549 cells (48 h.p.i. MOI = 3). Magnification: 600X; scale bar: 10 μm (B) Conventional indirect immunofluorescence showing the presence of γH2AFX and TP53BP1 in mock and infected A549 cells (48 h.p.i. MOI = 3). Magnification: 600X; scale bar: 10 μm. Quantification of the DNA damage foci containing γH2AFX and TP53BP1 is shown at the right panel. (C) Detection by western-blotting of various DNA damage and proliferation arrest markers in mock and infected A549 cells (30 h.p.i. MOI = 3: panels P-TP53, CDKN2A, P-RB1, P-ATM); 48 h.p.i. MOI = 3: panels CDKN1A and γH2FAX. KDa: kilodaltons. Bars in the graphs represent the mean ± SD of 2 experiments, n = 3 replicates. DNA damage foci were counted from >150 cells for each experimental condition. Data from panel c are of a representative experiment.

Figure 3. HRSV induces mitochondrial reactive oxygen species (ROS). (A) Measurement of total ROS levels of mock and infected A549 cells (48 h.p.i. MOI = 3) using the DCFH-DA probe and fluorometry. (B) Measurement of reduced (GSH) and oxidized (GSSG) glutathione of mock and infected A549 cells (24 h.p.i. MOI = 3). (C) Evaluation of mitochondrial ROS in mock and infected A549 cells (24 h.p.i. MOI = 3) with MitoSOX and fluorescence microscopy. Positive control: cells treated with 100 μM Paraquat. Images of cells treated with Paraquat, acquired at the same exposure to that of the rest of the samples (equivalent exposure) and at a reduced exposure, are shown. Magnification: 400X; scale bar: 20 μm. (D) Assessment of mitochondrial ROS levels of mock and infected A549 cells (24 h.p.i. MOI = 3) with MitoSOX and flow cytometry. The left panel shows representative histograms. The mean intensity of MitoSOX fluorescence and the percentage of positive cells are shown at the right panel. Bars represent the mean ± SD of two experiments, ANOVA of data D: P < 0,0001; n = 3 replicates.
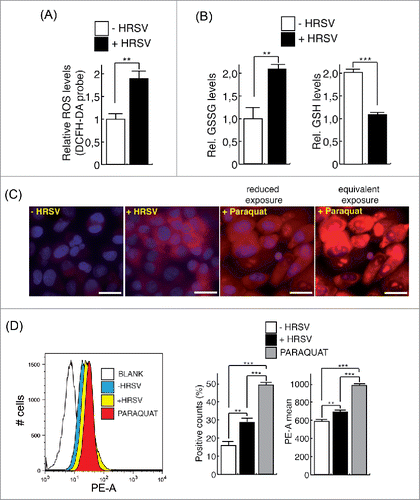
Figure 3. HRSV induces mitochondrial reactive oxygen species (ROS). (A) Measurement of total ROS levels of mock and infected A549 cells (48 h.p.i. MOI = 3) using the DCFH-DA probe and fluorometry. (B) Measurement of reduced (GSH) and oxidized (GSSG) glutathione of mock and infected A549 cells (24 h.p.i. MOI = 3). (C) Evaluation of mitochondrial ROS in mock and infected A549 cells (24 h.p.i. MOI = 3) with MitoSOX and fluorescence microscopy. Positive control: cells treated with 100 μM Paraquat. Images of cells treated with Paraquat, acquired at the same exposure to that of the rest of the samples (equivalent exposure) and at a reduced exposure, are shown. Magnification: 400X; scale bar: 20 μm. (D) Assessment of mitochondrial ROS levels of mock and infected A549 cells (24 h.p.i. MOI = 3) with MitoSOX and flow cytometry. The left panel shows representative histograms. The mean intensity of MitoSOX fluorescence and the percentage of positive cells are shown at the right panel. Bars represent the mean ± SD of two experiments, ANOVA of data D: P < 0,0001; n = 3 replicates.

Figure 4. HRSV-induced DNA damage is reduced with antioxidant treatments (A) Quantification of DNA damage foci containing γH2AFX and TP53BP1 in mock and infected A549 cells (48 h.p.i. MOI = 3), treated or not with N-Acetylcysteine (NAC). Cells were treated with 5 mM NAC 90 min before the infection and then after virus adsorption until the end of the experiment. (B) Virus titers in supernatants of A549 infected cells (48 h.p.i. MOI = 3) treated or not with 5 mM NAC. (C) Representative images of DNA damage foci of mock and infected A549 cells (48 h.p.i. MOI = 3), treated or not with N-Acetylcysteine (NAC). Magnification: 600X; scale bar: 10 μm. Arrowheads: DD foci. (D) Increase of intracellular reduced glutathione (GSH) in mock and infected A549 cells (24 h.p.i. MOI = 3) upon treatment with 2,5 mM GSH ethyl ester (GSHee). (E) Quantification of DNA damage foci containing γH2AFX and TP53BP1 in mock and infected A549 cells (48 h.p.i. MOI = 3) treated or not with GSHee. Cells were treated with GSHee 90 min before the infection and then after virus adsorption until the end of the experiment. Virus titers in supernatants of A549 infected cells (48 h.p.i. MOI = 3) treated or not with 2,5 mM GSHee (right panel). (F) Representative images of DNA damage foci in mock and infected A549 cells (48 h.p.i. MOI = 3), treated or not with GSHee. Magnification: 600X; scale bar: 10 μm. (G) Left panel: Expression of transfected catalase (flagged-catalase, in green) and DD foci (TP53BP1 in red) in A549 cells infected with HRSV (48 h.p.i. MOI = 3) and transfected with the plasmid pCMV3-CAT-N-FLAG. Cells labeled as “b” and “c” show catalase overexpression and the absence of DD foci; syncytium labeled as “a” shows the absence of significant catalase overexpression and the presence of nuclei harboring numerous DD foci. Right panel: expression of DD foci (TP53BP1) and HRSV-F glycoprotein (green) in A549 infected cells (48 h.p.i. MOI = 3) Magnification 600X, Scale bar: 10 μM. (h) Left: panel: Quantification of DD foci in A549 cells infected with HRSV (48 h.p.i. MOI = 3) and transfected with the plasmid pCMV3-CT-N-FLAG. CAT: cells without significant catalase overexpression, CAT+: cells overexpressing catalase. Right panel: virus titers of culture supernatants of A549 cells infected with HRSV (48 h.p.i. MOI = 3) and transfected with either empty vector as a control or catalase (CAT) plasmid. Bars represent the mean ± SD of two experimenst; n = 3 replicates. DNA damage foci were counted from >150 cells for each experimental condition.
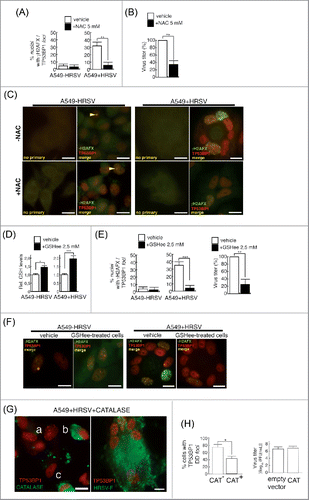
Figure 4. HRSV-induced DNA damage is reduced with antioxidant treatments (A) Quantification of DNA damage foci containing γH2AFX and TP53BP1 in mock and infected A549 cells (48 h.p.i. MOI = 3), treated or not with N-Acetylcysteine (NAC). Cells were treated with 5 mM NAC 90 min before the infection and then after virus adsorption until the end of the experiment. (B) Virus titers in supernatants of A549 infected cells (48 h.p.i. MOI = 3) treated or not with 5 mM NAC. (C) Representative images of DNA damage foci of mock and infected A549 cells (48 h.p.i. MOI = 3), treated or not with N-Acetylcysteine (NAC). Magnification: 600X; scale bar: 10 μm. Arrowheads: DD foci. (D) Increase of intracellular reduced glutathione (GSH) in mock and infected A549 cells (24 h.p.i. MOI = 3) upon treatment with 2,5 mM GSH ethyl ester (GSHee). (E) Quantification of DNA damage foci containing γH2AFX and TP53BP1 in mock and infected A549 cells (48 h.p.i. MOI = 3) treated or not with GSHee. Cells were treated with GSHee 90 min before the infection and then after virus adsorption until the end of the experiment. Virus titers in supernatants of A549 infected cells (48 h.p.i. MOI = 3) treated or not with 2,5 mM GSHee (right panel). (F) Representative images of DNA damage foci in mock and infected A549 cells (48 h.p.i. MOI = 3), treated or not with GSHee. Magnification: 600X; scale bar: 10 μm. (G) Left panel: Expression of transfected catalase (flagged-catalase, in green) and DD foci (TP53BP1 in red) in A549 cells infected with HRSV (48 h.p.i. MOI = 3) and transfected with the plasmid pCMV3-CAT-N-FLAG. Cells labeled as “b” and “c” show catalase overexpression and the absence of DD foci; syncytium labeled as “a” shows the absence of significant catalase overexpression and the presence of nuclei harboring numerous DD foci. Right panel: expression of DD foci (TP53BP1) and HRSV-F glycoprotein (green) in A549 infected cells (48 h.p.i. MOI = 3) Magnification 600X, Scale bar: 10 μM. (h) Left: panel: Quantification of DD foci in A549 cells infected with HRSV (48 h.p.i. MOI = 3) and transfected with the plasmid pCMV3-CT-N-FLAG. CAT−: cells without significant catalase overexpression, CAT+: cells overexpressing catalase. Right panel: virus titers of culture supernatants of A549 cells infected with HRSV (48 h.p.i. MOI = 3) and transfected with either empty vector as a control or catalase (CAT) plasmid. Bars represent the mean ± SD of two experimenst; n = 3 replicates. DNA damage foci were counted from >150 cells for each experimental condition.

Figure 5. Expression of markers of DNA damage and aging in lungs of mice infected by HRSV. (A) Epithelial lung tissue from mock-infected mice stained with antibodies: αHRSV (pool of antibodies against HRSV) and γH2AFX. (B) Representative image of multiple immunofluorescence labeling with αHRSV and γH2AFX antibodies of lung tissue from HRSV-infected mice stained. (C), (D) Representative images of negative controls (no primary) of the multiple immunofluorescence labeling of epithelial lung tissue. Magnifications: 600X; scale bar: 10 μm. Arrowheads signal cells showing reactivity to γH2AFX. AE: alveolar epithelium, Br: bronchiole, CSCE: ciliated simple columnar epithelium. (E) Representative images of conventional immunohistochemistry of γ-H2AFX and CDKN2A on mice lung tissue (mock-infected or infected with HRSV) at 4 days post-infection. (F) Representative images of conventional immunohistochemistry of γH2AFX and CDKN2A on mice lung tissue at 11 and 30 days post-infection. Arrowheads signal cells showing reactivity to γH2AFX and CDKN2A. Two experiments, n = 5 (mock-infected) or 6 (infected) replicates (mice) per condition.
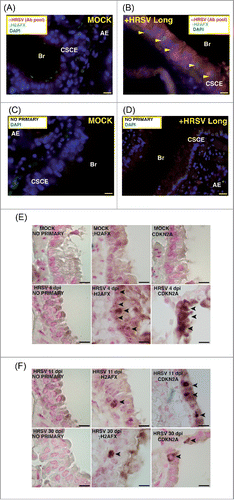
Figure 5. Expression of markers of DNA damage and aging in lungs of mice infected by HRSV. (A) Epithelial lung tissue from mock-infected mice stained with antibodies: αHRSV (pool of antibodies against HRSV) and γH2AFX. (B) Representative image of multiple immunofluorescence labeling with αHRSV and γH2AFX antibodies of lung tissue from HRSV-infected mice stained. (C), (D) Representative images of negative controls (no primary) of the multiple immunofluorescence labeling of epithelial lung tissue. Magnifications: 600X; scale bar: 10 μm. Arrowheads signal cells showing reactivity to γH2AFX. AE: alveolar epithelium, Br: bronchiole, CSCE: ciliated simple columnar epithelium. (E) Representative images of conventional immunohistochemistry of γ-H2AFX and CDKN2A on mice lung tissue (mock-infected or infected with HRSV) at 4 days post-infection. (F) Representative images of conventional immunohistochemistry of γH2AFX and CDKN2A on mice lung tissue at 11 and 30 days post-infection. Arrowheads signal cells showing reactivity to γH2AFX and CDKN2A. Two experiments, n = 5 (mock-infected) or 6 (infected) replicates (mice) per condition.
Supplemental material

KVIR_A_1144001.pdf

Download PDF (9.2 MB)

Reprints and Corporate Permissions

Please note: Selecting permissions does not provide access to the full text of the article, please see our help page How do I view content?

To request a reprint or corporate permissions for this article, please click on the relevant link below:

Academic Permissions

Please note: Selecting permissions does not provide access to the full text of the article, please see our help page How do I view content?

Obtain permissions instantly via Rightslink by clicking on the button below:

If you are unable to obtain permissions via Rightslink, please complete and submit this Permissions form. For more information, please visit our Permissions help page.