2,441
Views
41
CrossRef citations to date
0
Altmetric
Research Paper

Analysis of the role of the LH92_11085 gene of a biofilm hyper-producing Acinetobacter baumannii strain on biofilm formation and attachment to eukaryotic cells

, , , , , , , , , , , & show all
Pages 443-455 | Received 09 Dec 2015, Accepted 19 Jan 2016, Published online: 17 Mar 2016

Figures & data

Figure 1. Quantification of biofilm formation in 25 A. baumannii clinical isolates selected from a collection of 172 hospital-acquired strains during the 2nd Spanish Study of colonization/infection caused by A. baumannii (GEIH/REIPI-Ab2010). Experiments were performed in triplicate and each bar represents the mean ± standard deviation (* P value < 0.0001).
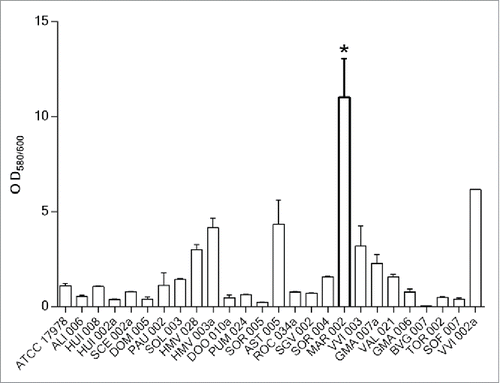
Figure 1. Quantification of biofilm formation in 25 A. baumannii clinical isolates selected from a collection of 172 hospital-acquired strains during the 2nd Spanish Study of colonization/infection caused by A. baumannii (GEIH/REIPI-Ab2010). Experiments were performed in triplicate and each bar represents the mean ± standard deviation (* P value < 0.0001).

Table 1 Expression level of genes involved in pili formation detected in planktonic and biofilm-associated cells of the MAR002 strain, assessed by qRT-PCR.

Figure 2. cDNA amplification of genes from the LH92_11070-11085 operon of A. baumannii MAR002 strain. The intergenic regions from genes LH92_11070-11075, LH92_11075-11080 and LH92_11080-11085 are shown in lanes 1, 2 and 3, respectively. Genomic DNA was used as template for positive control (lanes 6 to 8, respectively). Lanes 4 and 9 show the gyrB amplification from cDNA and DNA, respectively (positive controls). Lane 5 shows the GeneRuler 1 kb Plus DNA Ladder (Thermo Fisher Scientific).
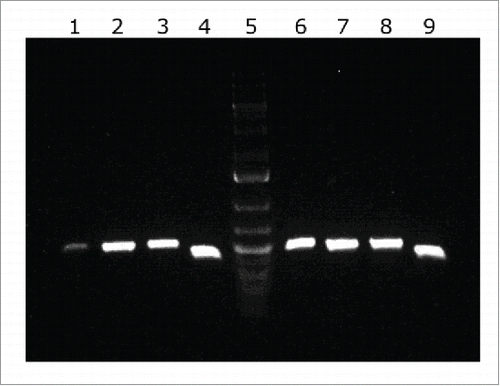
Figure 2. cDNA amplification of genes from the LH92_11070-11085 operon of A. baumannii MAR002 strain. The intergenic regions from genes LH92_11070-11075, LH92_11075-11080 and LH92_11080-11085 are shown in lanes 1, 2 and 3, respectively. Genomic DNA was used as template for positive control (lanes 6 to 8, respectively). Lanes 4 and 9 show the gyrB amplification from cDNA and DNA, respectively (positive controls). Lane 5 shows the GeneRuler 1 kb Plus DNA Ladder (Thermo Fisher Scientific).

Figure 3. A) Quantification of biofilm formation by crystal violet staining. Eight independent replicates were done. Student´s t-test was done, values are means and bars indicate the standard deviation. B) SEM analysis of bacterial biofilm on plastic surface at the liquid-air interface of the A. baumannii strains a) ATCC 17978, b) MAR002, c) MAR002Δ11085 and d) MAR002Δ11085 complemented. All micrographs were taken at 5,000x magnification. Bars indicate the scale marks (2 μm).
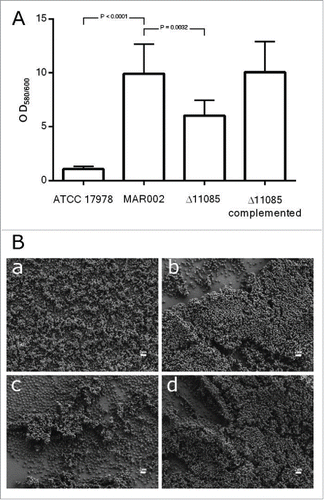
Figure 3. A) Quantification of biofilm formation by crystal violet staining. Eight independent replicates were done. Student´s t-test was done, values are means and bars indicate the standard deviation. B) SEM analysis of bacterial biofilm on plastic surface at the liquid-air interface of the A. baumannii strains a) ATCC 17978, b) MAR002, c) MAR002Δ11085 and d) MAR002Δ11085 complemented. All micrographs were taken at 5,000x magnification. Bars indicate the scale marks (2 μm).

Figure 4. Quantification of bacterial adhesion to A549 human alveolar epithelial cells by A. baumannii ATCC 17978, MAR002, MAR002Δ11085 (Δ11085) and MAR002Δ11085 complemented (Δ11085 complemented). A) Percentage of attached bacteria after 3 h of infection. B) Percentage of attached bacteria after 24 h of infection. Four independent replicates were performed. T-student test were done and bars indicate the standard deviation.
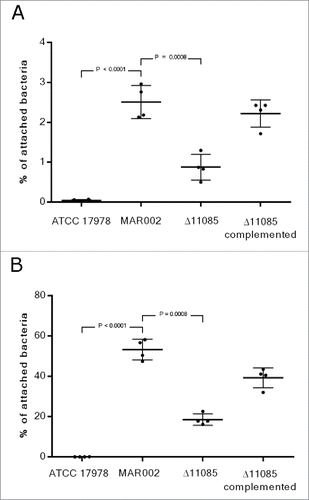
Figure 4. Quantification of bacterial adhesion to A549 human alveolar epithelial cells by A. baumannii ATCC 17978, MAR002, MAR002Δ11085 (Δ11085) and MAR002Δ11085 complemented (Δ11085 complemented). A) Percentage of attached bacteria after 3 h of infection. B) Percentage of attached bacteria after 24 h of infection. Four independent replicates were performed. T-student test were done and bars indicate the standard deviation.

Figure 5. SEM analysis of bacterial attachment to A549 human alveolar epithelial cells. Uninfected and healthy A549 cells covered by surfactant are shown in micrograph A as a negative control. A549 cells were infected with A. baumannii ATCC 17978 strain (B), with the MAR002 parental strain (C) and (D), with the MAR002 mutant strain lacking LH92_11085 (Δ11085) (E) or the mutant strain (Δ11085) complemented (F). All micrographs were taken at 5,000x magnification. Bars indicate the scale (2 µm).
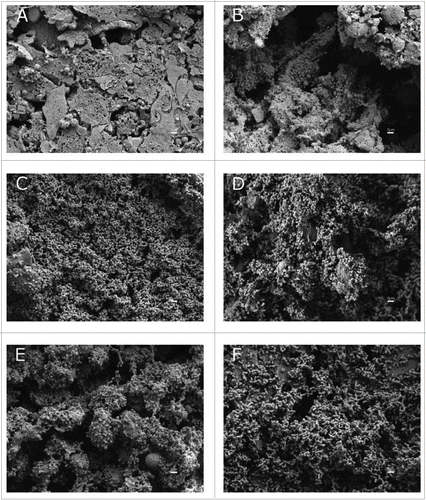
Figure 5. SEM analysis of bacterial attachment to A549 human alveolar epithelial cells. Uninfected and healthy A549 cells covered by surfactant are shown in micrograph A as a negative control. A549 cells were infected with A. baumannii ATCC 17978 strain (B), with the MAR002 parental strain (C) and (D), with the MAR002 mutant strain lacking LH92_11085 (Δ11085) (E) or the mutant strain (Δ11085) complemented (F). All micrographs were taken at 5,000x magnification. Bars indicate the scale (2 µm).

Figure 6. TEM images of A. baumannii strains ATCC 17978 (A), MAR002 (B), MAR002Δ11085 (C) and complemented MAR002Δ11085 (D). Images were taken at 50,000x magnification. The longer thin pili present in small amounts are pointed out by white arrows. The shorter thick pili that form a dense halo around the surface are pointed by black arrows. Bars indicate the scale (500 nm).
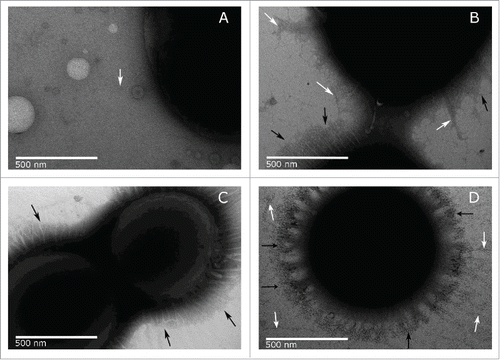
Figure 6. TEM images of A. baumannii strains ATCC 17978 (A), MAR002 (B), MAR002Δ11085 (C) and complemented MAR002Δ11085 (D). Images were taken at 50,000x magnification. The longer thin pili present in small amounts are pointed out by white arrows. The shorter thick pili that form a dense halo around the surface are pointed by black arrows. Bars indicate the scale (500 nm).

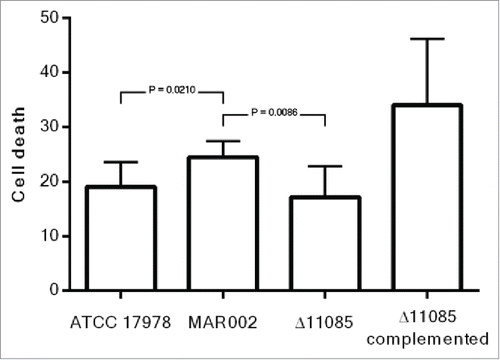
Figure 7. Quantification of A549 cell death caused by A. baumannii ATCC 17978, MAR002, MAR002Δ11085 (Δ11085) and MAR002Δ11085 complemented (Δ11085 complemented). Four independent replicates were performed. T-student test were done and bars indicate the standard deviation.

Figure 7. Quantification of A549 cell death caused by A. baumannii ATCC 17978, MAR002, MAR002Δ11085 (Δ11085) and MAR002Δ11085 complemented (Δ11085 complemented). Four independent replicates were performed. T-student test were done and bars indicate the standard deviation.
Supplemental material

KVIR_A_S1145335.docx

Download MS Word (15.1 KB)