3,147
Views
64
CrossRef citations to date
0
Altmetric
Research Paper

Antimicrobial blue light inactivation of Candida albicans: In vitro and in vivo studies

, , , , , , , , & show all
Pages 536-545 | Received 12 Oct 2015, Accepted 12 Feb 2016, Published online: 21 Apr 2016

Figures & data

Figure 1. Antimicrobial blue light inactivation of C. albicans and human keratinocytes in vitro. Bars: standard deviation. The mean inactivation rate coefficients (kH) of C. albicans and keratinocytes were 0.0795 and 0.0019 cm2/J, respectively, indicating an approximately 42-fold faster inactivation rate of C. albicans by aBL than keratinocytes.
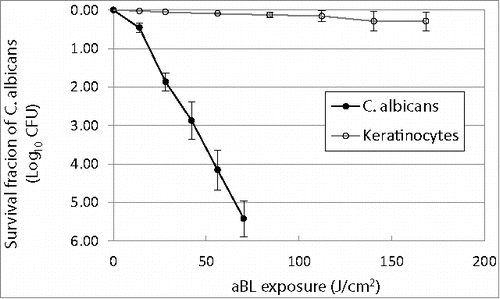
Figure 1. Antimicrobial blue light inactivation of C. albicans and human keratinocytes in vitro. Bars: standard deviation. The mean inactivation rate coefficients (kH) of C. albicans and keratinocytes were 0.0795 and 0.0019 cm2/J, respectively, indicating an approximately 42-fold faster inactivation rate of C. albicans by aBL than keratinocytes.

Figure 2. TEM images of C. albicans cells. (A) Untreated C. albicans cells: N=nucleus; V = vacuole; M=mitochondria; CM = cytoplasmic membrane; CW = cell wall. (B)-(D) aBL-treated C. albicans cells: (B) Decomposition of inner organelles with deformed cell wall (aBL radiant exposure = 35.1 J/cm2); (C) Unusual vacuole growth, driving electron-dense structures to the cell periphery (aBL radiant exposure = 35.1 J/cm2); and (D) Complete loss of cytoplasmic components with disrupted cell wall (aBL radiant exposure = 70.2 J/cm2).
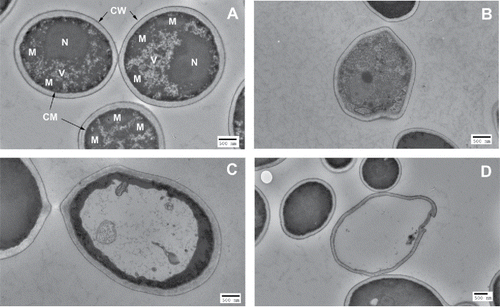
Figure 2. TEM images of C. albicans cells. (A) Untreated C. albicans cells: N=nucleus; V = vacuole; M=mitochondria; CM = cytoplasmic membrane; CW = cell wall. (B)-(D) aBL-treated C. albicans cells: (B) Decomposition of inner organelles with deformed cell wall (aBL radiant exposure = 35.1 J/cm2); (C) Unusual vacuole growth, driving electron-dense structures to the cell periphery (aBL radiant exposure = 35.1 J/cm2); and (D) Complete loss of cytoplasmic components with disrupted cell wall (aBL radiant exposure = 70.2 J/cm2).

Figure 3. Fluorescence emission spectra of lysed C. albicans cells in NaOH/SDS: (A) Excitation at 405 nm led to porphyrin-like dual fluorescence emission maxima at 631 and 667 nm; (B) Excitation at 470 nm gave rise to a flavin-like emission maximum at 515 nm.
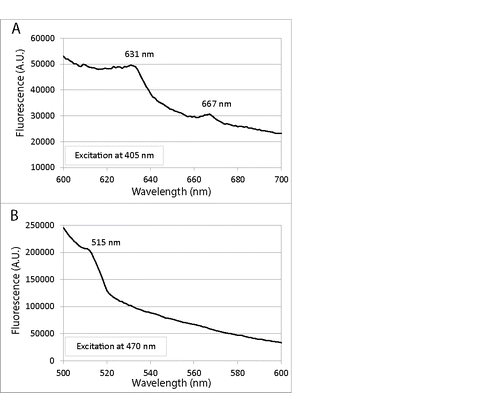
Figure 3. Fluorescence emission spectra of lysed C. albicans cells in NaOH/SDS: (A) Excitation at 405 nm led to porphyrin-like dual fluorescence emission maxima at 631 and 667 nm; (B) Excitation at 470 nm gave rise to a flavin-like emission maximum at 515 nm.

Figure 4. Change of extent of aBL inactivation of C. albicans (log10 CFU) with numbers of passages of C. albicans on aBL exposure. Bars: standard deviation. No statistically significant difference was observed in aBL inactivation extent between the 1st and 10th passage (P = 0.09).
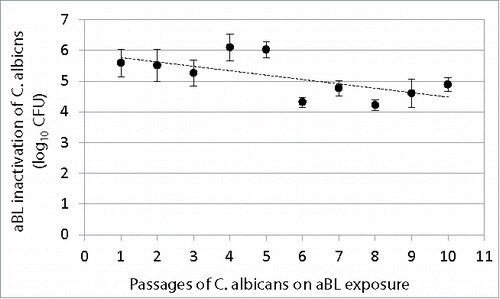
Figure 4. Change of extent of aBL inactivation of C. albicans (log10 CFU) with numbers of passages of C. albicans on aBL exposure. Bars: standard deviation. No statistically significant difference was observed in aBL inactivation extent between the 1st and 10th passage (P = 0.09).

Figure 5. (A-B) Successive fungal luminescence images of representative mouse burns infected with 105 CFU of bioluminescent C. albicans, with (panel A) and without aBL therapy (panel B), respectively. aBL irradiance = 90 mW/cm2. aBL was delivered at 12 h after fungal inoculation. In panel A, the Day 1-0 J/cm2 image was taken just prior to aBL exposure; Day 1-27 J/cm2, Day 1- 54 J/cm2, Day 1-81 J/cm2, Day 1-108 J/cm2, Day 1-162 J/cm2, Day 1-216 J/cm2, Day 1-324 J/cm2 and Day 1- 432 J/cm2 images were taken immediately after respective aBL exposure had been delivered; and the Day 1 to Day 8 images were taken at Day 1 to Day 8 after fungal inoculation, respectively. In panel B, the Day 1 to Day 8 images were taken at Day 1 to Day 8 after fungal inoculation, respectively. (C) Dose responses of mean fungal luminescence of mouse burns infected with 105 CFU of C. albicans, with (n = 8) and without (n = 8) aBL therapy, respectively. aBL was delivered at 12 h after fungal inoculation. Bars: standard deviation.
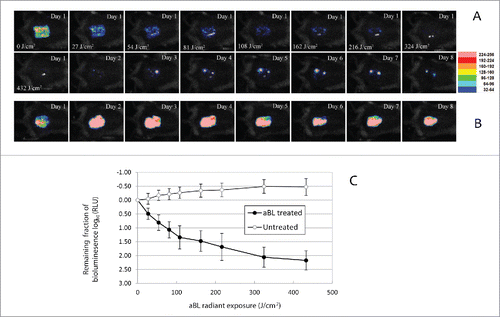
Figure 5. (A-B) Successive fungal luminescence images of representative mouse burns infected with 105 CFU of bioluminescent C. albicans, with (panel A) and without aBL therapy (panel B), respectively. aBL irradiance = 90 mW/cm2. aBL was delivered at 12 h after fungal inoculation. In panel A, the Day 1-0 J/cm2 image was taken just prior to aBL exposure; Day 1-27 J/cm2, Day 1- 54 J/cm2, Day 1-81 J/cm2, Day 1-108 J/cm2, Day 1-162 J/cm2, Day 1-216 J/cm2, Day 1-324 J/cm2 and Day 1- 432 J/cm2 images were taken immediately after respective aBL exposure had been delivered; and the Day 1 to Day 8 images were taken at Day 1 to Day 8 after fungal inoculation, respectively. In panel B, the Day 1 to Day 8 images were taken at Day 1 to Day 8 after fungal inoculation, respectively. (C) Dose responses of mean fungal luminescence of mouse burns infected with 105 CFU of C. albicans, with (n = 8) and without (n = 8) aBL therapy, respectively. aBL was delivered at 12 h after fungal inoculation. Bars: standard deviation.

Figure 6. (A) Time courses of mean fungal luminescence (RLU, day 2 to day 11) of mouse burns infected with 105 CFU of C. albicans, with (n=8) and without (n=8) aBL therapy, respectively. aBL was delivered at 12 h after fungal inoculation. Bars: standard deviation. (B) Mean areas under the fungal luminescence versus time curves in the two-dimensional coordinate system in panel A, representing the overall fungal burden of infected mouse burns. Bars: standard deviation.
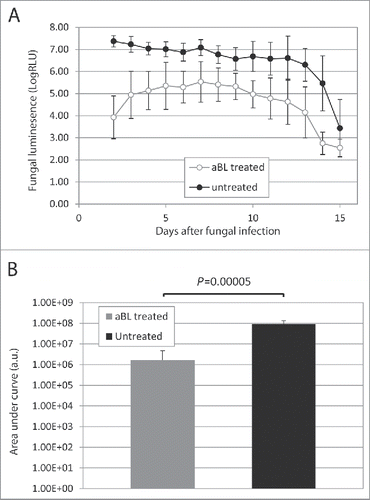
Figure 6. (A) Time courses of mean fungal luminescence (RLU, day 2 to day 11) of mouse burns infected with 105 CFU of C. albicans, with (n=8) and without (n=8) aBL therapy, respectively. aBL was delivered at 12 h after fungal inoculation. Bars: standard deviation. (B) Mean areas under the fungal luminescence versus time curves in the two-dimensional coordinate system in panel A, representing the overall fungal burden of infected mouse burns. Bars: standard deviation.

Reprints and Corporate Permissions

Please note: Selecting permissions does not provide access to the full text of the article, please see our help page How do I view content?

To request a reprint or corporate permissions for this article, please click on the relevant link below:

Academic Permissions

Please note: Selecting permissions does not provide access to the full text of the article, please see our help page How do I view content?

Obtain permissions instantly via Rightslink by clicking on the button below:

If you are unable to obtain permissions via Rightslink, please complete and submit this Permissions form. For more information, please visit our Permissions help page.