1,249
Views
22
CrossRef citations to date
0
Altmetric
Research Paper

The Cek1‑mediated MAP kinase pathway regulates exposure of α‑1,2 and β‑1,2‑mannosides in the cell wall of Candida albicans modulating immune recognition

, , , , , , & show all
Pages 558-577 | Received 23 Nov 2015, Accepted 28 Feb 2016, Published online: 18 May 2016

Figures & data

Figure 1. Analysis of the effect of tunicamycin treatment on C. albicans transcriptional response and on cek1 cell wall. (A) Heat map showing differentially expressed genes in cek1 versus CAF2 cells under basal (exponentially growing, not treated with tunicamycin) conditions. (B) Venn diagrams showing up‑ and down‑regulated genes (left and right panel, respectively) upon 2 hours treatment of wild type (CAF2) and cek1 mutant with tunicamycin (TUN). Specific genes to the wild type strain or cek1 mutant are shown in green or red respectively, while commonly regulated genes are represented in yellow. (C) Cells from a stationary culture were diluted in fresh pre‑warmed YEPD or YEPD supplemented with tunicamycin (5 μg/mL), and grown at 37ºC for 2 hours before being collected and processed for TEM analysis. Magnifications of wt and cek1 untreated cells are shown to the right. (D) A representative histogram of cells´ β‑glucan exposure at the end of the experiment (2h). (E) Fold induction of β‑glucan exposure after tunicamycin treatment vs no treatment (induction TUN / no TUN). * indicates p < 0.05 (p = 0.028) as determined using an independent t-Student's test (n = 3).
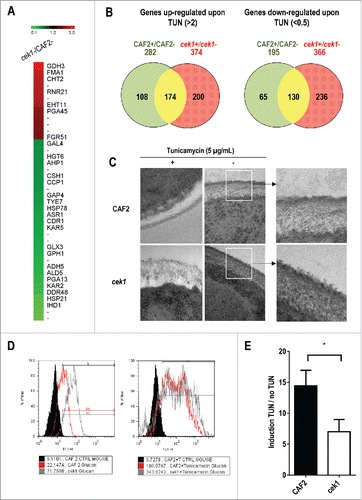
Figure 1. Analysis of the effect of tunicamycin treatment on C. albicans transcriptional response and on cek1 cell wall. (A) Heat map showing differentially expressed genes in cek1 versus CAF2 cells under basal (exponentially growing, not treated with tunicamycin) conditions. (B) Venn diagrams showing up‑ and down‑regulated genes (left and right panel, respectively) upon 2 hours treatment of wild type (CAF2) and cek1 mutant with tunicamycin (TUN). Specific genes to the wild type strain or cek1 mutant are shown in green or red respectively, while commonly regulated genes are represented in yellow. (C) Cells from a stationary culture were diluted in fresh pre‑warmed YEPD or YEPD supplemented with tunicamycin (5 μg/mL), and grown at 37ºC for 2 hours before being collected and processed for TEM analysis. Magnifications of wt and cek1 untreated cells are shown to the right. (D) A representative histogram of cells´ β‑glucan exposure at the end of the experiment (2h). (E) Fold induction of β‑glucan exposure after tunicamycin treatment vs no treatment (induction TUN / no TUN). * indicates p < 0.05 (p = 0.028) as determined using an independent t-Student's test (n = 3).

Figure 2. Levels of α‑ and β‑mannosides at the cell wall surface of strains defective in elements from the MAPK signaling network. Cells from stationary cultures of CAF2, cek1, hst7, mkc1 and hog1 mutants were analyzed by flow cytometry to detect the levels of α‑1,2‑ and β‑1,2‑mannosides (α‑M and β‑M), recognized by the specific antibodies EB‑CA1 (A) and 5B2 (B) respectively. Representative histograms (the red histogram refers to samples treated only with the secondary antibody) and mean fluorescence intensities (MFI) from three independent experiments with the corresponding standard deviation are shown. One way ANOVA followed by Dunnet's correction for multiple comparisons was applied to evaluate differences between mutants and wild type strain (*p < 0.05, **p < 0.01, ***p < 0.001, ****p < 0.0001). MFI absolute values for CAF2 cells were 665.8 (A) and 170.8 (B).
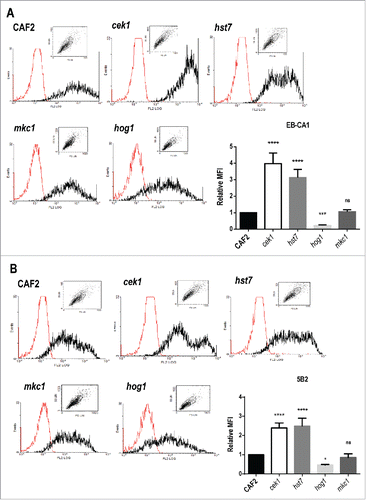
Figure 2. Levels of α‑ and β‑mannosides at the cell wall surface of strains defective in elements from the MAPK signaling network. Cells from stationary cultures of CAF2, cek1, hst7, mkc1 and hog1 mutants were analyzed by flow cytometry to detect the levels of α‑1,2‑ and β‑1,2‑mannosides (α‑M and β‑M), recognized by the specific antibodies EB‑CA1 (A) and 5B2 (B) respectively. Representative histograms (the red histogram refers to samples treated only with the secondary antibody) and mean fluorescence intensities (MFI) from three independent experiments with the corresponding standard deviation are shown. One way ANOVA followed by Dunnet's correction for multiple comparisons was applied to evaluate differences between mutants and wild type strain (*p < 0.05, **p < 0.01, ***p < 0.001, ****p < 0.0001). MFI absolute values for CAF2 cells were 665.8 (A) and 170.8 (B).

Figure 3. Mapping glycan epitopes in cek1 mutants. (A) Different cell wall fractions from stationary (st) and exponential (x) phase cultures of CAF2 and cek1 strains were separated by SDS-PAGE before blotting with 5B2 (β‑M) and EB-CA1 (α‑M) antibodies. CWMP extracts were released by heat treatment (Fraction 1), NaOH (Fraction 3) or zymolyase treatment (Fraction 4). (B) Zymolyase released CWMP extracts (fraction 4) from CAF2 and cek1 cells grown at exponential phase in RPMI media were separated by SDS-PAGE and analyzed by western blotting with the MAb 16B.1 for the detection of Hwp1. The predicted glycosylated form of Hwp1 is highlighted with an arrow. (C) Zymolyase (Fraction 4) extracts from the indicated strains grown at exponential phase in YEPD or RPMI media were analyzed with the mAb 2g8 for the detection of β‑1,3‑glucan.
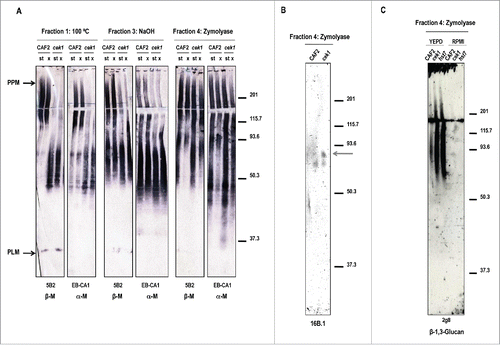
Figure 3. Mapping glycan epitopes in cek1 mutants. (A) Different cell wall fractions from stationary (st) and exponential (x) phase cultures of CAF2 and cek1 strains were separated by SDS-PAGE before blotting with 5B2 (β‑M) and EB-CA1 (α‑M) antibodies. CWMP extracts were released by heat treatment (Fraction 1), NaOH (Fraction 3) or zymolyase treatment (Fraction 4). (B) Zymolyase released CWMP extracts (fraction 4) from CAF2 and cek1 cells grown at exponential phase in RPMI media were separated by SDS-PAGE and analyzed by western blotting with the MAb 16B.1 for the detection of Hwp1. The predicted glycosylated form of Hwp1 is highlighted with an arrow. (C) Zymolyase (Fraction 4) extracts from the indicated strains grown at exponential phase in YEPD or RPMI media were analyzed with the mAb 2g8 for the detection of β‑1,3‑glucan.

Figure 4. Lactose blockage of C. albicans binding to murine macrophages. Representative flow cytometry analysis of CAF2 and cek1 (marked with FITC) binding to murine macrophages (MΦ – Raw 264.7 cell line) at MOI 10:1 (yeast: MΦ) and 30 min. interaction time on ice. Blockage with lactose (100 mM) was made 30 min. prior infection. The graphic shows the percentage of bound yeasts from independent experiments (n = 4). * p < 0.05.
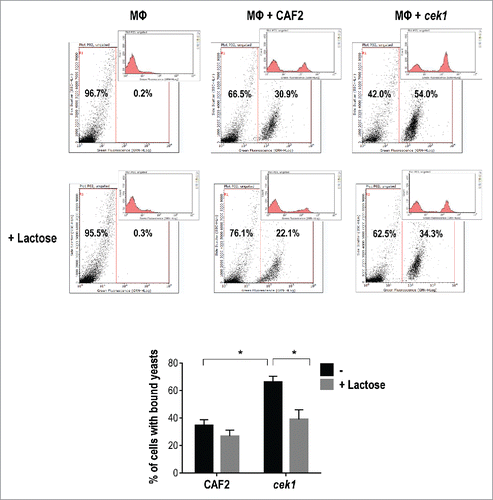
Figure 4. Lactose blockage of C. albicans binding to murine macrophages. Representative flow cytometry analysis of CAF2 and cek1 (marked with FITC) binding to murine macrophages (MΦ – Raw 264.7 cell line) at MOI 10:1 (yeast: MΦ) and 30 min. interaction time on ice. Blockage with lactose (100 mM) was made 30 min. prior infection. The graphic shows the percentage of bound yeasts from independent experiments (n = 4). * p < 0.05.

Figure 5. For figure legend, see page 10

Figure 5. For figure legend, see page 10

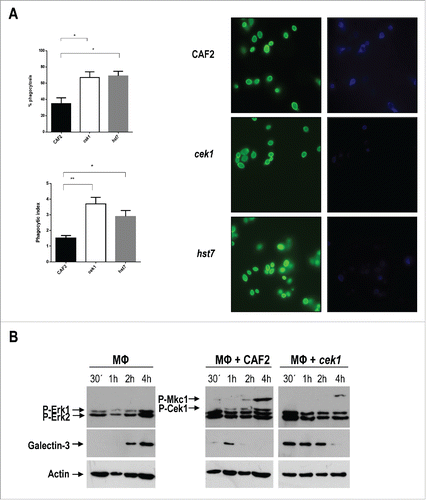
Figure 5. Analysis of galectin‑3 expression by murine macrophages upon interaction with C. albicans cells. (A) Phagocytosis by murine macrophages of the cek1 and hst7 mutants vs. the CAF2 wild type strain. Percentage of phagocytosed fungal cells (Upper subfigure) or Phagocytic index (Lower subfigure) assessed by counting number of internalized yeast per 100 phagocytes (at least 10 fields on each immunofluorescence carried out in duplicate). Data from phagocytic assays were collected in at least 3 independent experiments. (*p < 0.05, ** p < 0.01). Fluorescent microscopy images showing extracellular yeast (blue) and both extra and intracellular yeast (green) are shown. (B) Immunodetection analysis of cells recovered from interaction studies between C. albicans and murine macrophages. Wild type (CAF2) or cek1 mutant cells were added to a confluent monolayer of macrophages (Raw 264.7 – MΦ) at MOI 10:1 (yeast: MΦ) and let to interact at 37ºC. Cells were collected at the indicated time-points and treated for immunoblot detection of MAPKs and ERKs activation pattern (anti-phospho-p44/42) as well as for detection of galectin‑3 expression (anti‑galectin‑3). Anti-actin was used as loading control. (C) Immunofluorescence microscopy analysis of C. albicans cells (CAF2 and cek1) interacting with murine macrophages (MOI: 1:1, yeast: MΦ). Yeast cells are constitutively expressing RFP (visible in red) while galectin‑3 is visible in green. Right pictures are fluorescence merged images of green and red channels, while left pictures include the phase contrast image for clarity. Control macrophages without Candida cells are shown as -.
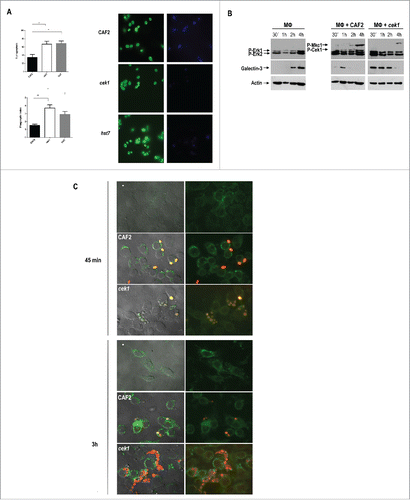
Figure 5. Analysis of galectin‑3 expression by murine macrophages upon interaction with C. albicans cells. (A) Phagocytosis by murine macrophages of the cek1 and hst7 mutants vs. the CAF2 wild type strain. Percentage of phagocytosed fungal cells (Upper subfigure) or Phagocytic index (Lower subfigure) assessed by counting number of internalized yeast per 100 phagocytes (at least 10 fields on each immunofluorescence carried out in duplicate). Data from phagocytic assays were collected in at least 3 independent experiments. (*p < 0.05, ** p < 0.01). Fluorescent microscopy images showing extracellular yeast (blue) and both extra and intracellular yeast (green) are shown. (B) Immunodetection analysis of cells recovered from interaction studies between C. albicans and murine macrophages. Wild type (CAF2) or cek1 mutant cells were added to a confluent monolayer of macrophages (Raw 264.7 – MΦ) at MOI 10:1 (yeast: MΦ) and let to interact at 37ºC. Cells were collected at the indicated time-points and treated for immunoblot detection of MAPKs and ERKs activation pattern (anti-phospho-p44/42) as well as for detection of galectin‑3 expression (anti‑galectin‑3). Anti-actin was used as loading control. (C) Immunofluorescence microscopy analysis of C. albicans cells (CAF2 and cek1) interacting with murine macrophages (MOI: 1:1, yeast: MΦ). Yeast cells are constitutively expressing RFP (visible in red) while galectin‑3 is visible in green. Right pictures are fluorescence merged images of green and red channels, while left pictures include the phase contrast image for clarity. Control macrophages without Candida cells are shown as -.

Figure 6. Role of galectin‑3 in a mouse model of systemic infection. 0.6 × 10⁶ cells of C. albicans were infected via the tail vein in galectin-3+/+ (wild type) and galectin-3−/− (knockout) C57BL/6J mice (CAF2: n = 3; cek1: n = 6). (A) Mice survival after C. albicans systemic infection. Statistical analysis was measured by log rank (Mantel-Cox) test, *p < 0.05, **p < 0.01. (B) Weight loss of infected mice during the survival assay. Data is shown as the weight mean of all mice until 50% of the infected group remained alive, related to initial individual weight prior to the infection. (C) Post-mortem analysis of fungal burden in target organs. *p < 0.05, **p < 0.01.
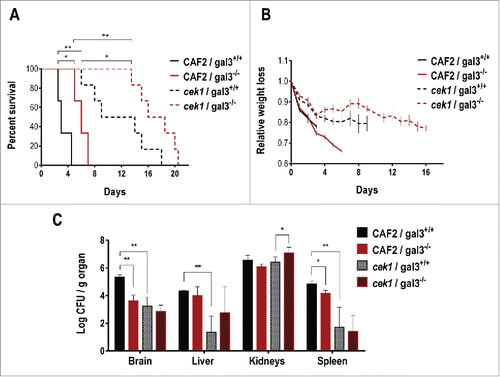
Figure 6. Role of galectin‑3 in a mouse model of systemic infection. 0.6 × 10⁶ cells of C. albicans were infected via the tail vein in galectin-3+/+ (wild type) and galectin-3−/− (knockout) C57BL/6J mice (CAF2: n = 3; cek1: n = 6). (A) Mice survival after C. albicans systemic infection. Statistical analysis was measured by log rank (Mantel-Cox) test, *p < 0.05, **p < 0.01. (B) Weight loss of infected mice during the survival assay. Data is shown as the weight mean of all mice until 50% of the infected group remained alive, related to initial individual weight prior to the infection. (C) Post-mortem analysis of fungal burden in target organs. *p < 0.05, **p < 0.01.
Supplemental material

KVIR_S_1163458.zip

Download Zip (538.5 KB)

Reprints and Corporate Permissions

Please note: Selecting permissions does not provide access to the full text of the article, please see our help page How do I view content?

To request a reprint or corporate permissions for this article, please click on the relevant link below:

Academic Permissions

Please note: Selecting permissions does not provide access to the full text of the article, please see our help page How do I view content?

Obtain permissions instantly via Rightslink by clicking on the button below:

If you are unable to obtain permissions via Rightslink, please complete and submit this Permissions form. For more information, please visit our Permissions help page.