1,315
Views
10
CrossRef citations to date
0
Altmetric
Research Paper

Prevalence of mip virulence gene and PCR-base sequence typing of Legionella pneumophila from cooling water systems of two cities in Iran

, , , &
Pages 602-609 | Received 19 Jan 2016, Accepted 22 Mar 2016, Published online: 20 Apr 2016

Figures & data

Figure 1. The map and sources of water samples analyzed for detection of L. pneumophila in this study. Both the Kerman and Bam cities were located in south east of Iran. Number of hospitals, building (homes / hotels) and nursing houses that water samples were taken are included in this figure.
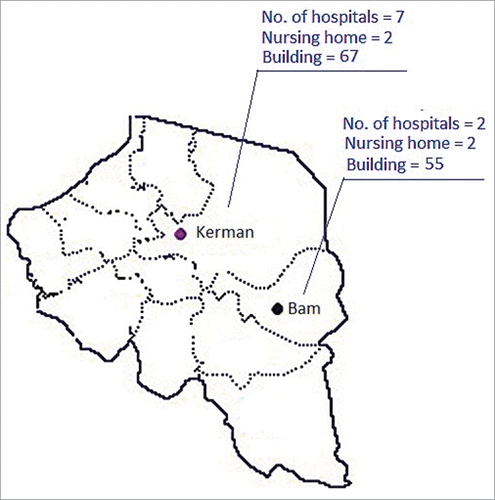
Figure 1. The map and sources of water samples analyzed for detection of L. pneumophila in this study. Both the Kerman and Bam cities were located in south east of Iran. Number of hospitals, building (homes / hotels) and nursing houses that water samples were taken are included in this figure.

Figure 2. Agarose gel electrophoresis amplification of L. pneumophila by A) conventional-PCR (340bp) and B) nested –PCR (124bp) of the mip gene detected in cooling water samples in this study. Lanes 7-9 and 12 are water samples from Bam. Lane 11 is positive control (340bp). Lanes 1 and 14 are ladder consist of 100 base pairs DNA fragments. NC = negative control.
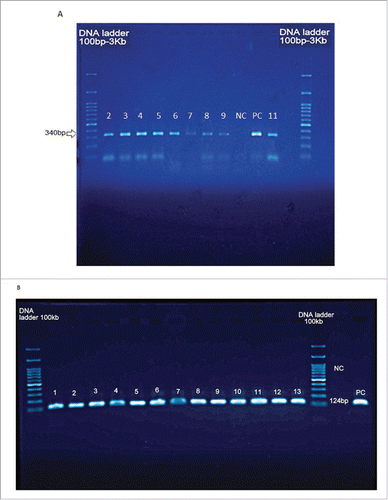
Figure 2. Agarose gel electrophoresis amplification of L. pneumophila by A) conventional-PCR (340bp) and B) nested –PCR (124bp) of the mip gene detected in cooling water samples in this study. Lanes 7-9 and 12 are water samples from Bam. Lane 11 is positive control (340bp). Lanes 1 and 14 are ladder consist of 100 base pairs DNA fragments. NC = negative control.

Figure 3. The real-time PCR detection of L. pneumophila mip gene isolated from water cooling systems investigated in this study. Panel: A) Real-time PCR of DNA extracted from water samples of Kerman and Bam. Panel: B) The standard curve with the CT plotted against the concentration of the starting quantity of template for each dilution

Figure 3. The real-time PCR detection of L. pneumophila mip gene isolated from water cooling systems investigated in this study. Panel: A) Real-time PCR of DNA extracted from water samples of Kerman and Bam. Panel: B) The standard curve with the CT plotted against the concentration of the starting quantity of template for each dilution

Figure 4. Dendrogram analysis of whole L. pneumophila genomic DNAs obtained from water samples of Bam and Kerman cities. Banding patterns were analyzed by UPGMA (unweighted pair-group method with arithmetic averages) clustering method using Gel Compare II software version 4.0 (Applied Maths, Sint-Matens-latem, Belgium). Degrees of homology were determined by Dice coefficient. Isolates that clustered >95% were considered related.
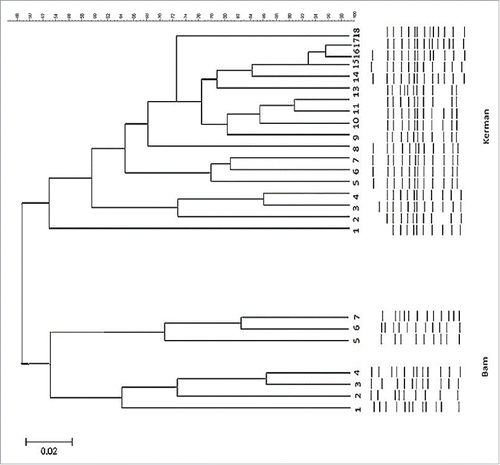
Figure 4. Dendrogram analysis of whole L. pneumophila genomic DNAs obtained from water samples of Bam and Kerman cities. Banding patterns were analyzed by UPGMA (unweighted pair-group method with arithmetic averages) clustering method using Gel Compare II software version 4.0 (Applied Maths, Sint-Matens-latem, Belgium). Degrees of homology were determined by Dice coefficient. Isolates that clustered >95% were considered related.

Table 1. Distribution of L. pneumophila mip gene detected in water samples collected from different cooling water systems in Kerman and Bam cities by nested and real-time PCR.

Reprints and Corporate Permissions

Please note: Selecting permissions does not provide access to the full text of the article, please see our help page How do I view content?

To request a reprint or corporate permissions for this article, please click on the relevant link below:

Academic Permissions

Please note: Selecting permissions does not provide access to the full text of the article, please see our help page How do I view content?

Obtain permissions instantly via Rightslink by clicking on the button below:

If you are unable to obtain permissions via Rightslink, please complete and submit this Permissions form. For more information, please visit our Permissions help page.