1,163
Views
8
CrossRef citations to date
0
Altmetric
Research Paper

Effector proteins support the asymmetric apportioning of Salmonella during cytokinesis

, &
Pages 669-678 | Received 30 Sep 2015, Accepted 26 Mar 2016, Published online: 05 May 2016

Figures & data

Figure 1. Observation of inter-cellular tubules (ICT). (A) HeLa cells were infected with wild-type Salmonella expressing CFP and PipB2-2HA. Cells were fixed at 16 h p.i., immunostained for LAMP-1 and HA, and imaged by confocal microscopy for CFP (blue), LAMP1 (green), HA (red) and nuclei (white). White and yellow dotted lines delineate 2 neighboring Salmonella-infected cells. Magnified insets in 4 colors or showing grayscale images for LAMP1 and PipB2 are presented. A LAMP1- and PipB2-positive Salmonella-induced tubule emerges from one cell and is in continuity with a similar tubule present in the adjacent cell. Arrows point Salmonella-induced tubules. Bar, 20 µm or 10 µm for the magnified insets. (B) Influence of the cell density on the formation of ICTs. HeLa cells were seeded at various surface ratio and infected 24 h later with GFP-expressing wild-type Salmonella at a MOI of 100:1. Cells were fixed at 16 h p.i. (C) Influence of the multiplicity of infection (MOI) on the formation of ICTs. HeLa cells were seeded at a surface ratio of 1:10 and infected 24 h later with various MOI of GFP-expressing wild-type Salmonella. Cells were fixed at 16 h p.i. (D) Kinetics of formation of ICTs. HeLa cells were seeded at a surface ratio of 1:10 and infected 24 h later with GFP-expressing wild-type Salmonella at a MOI of 100:1. Cells were fixed at different times p.i. (B - D) Infected cells presenting ICTs were enumerated by fluorescence microscopy. Data are the mean ± SD or representative (D) of 3 independent experiments. (B & C) Multiple t-tests were used to compare the mean values.
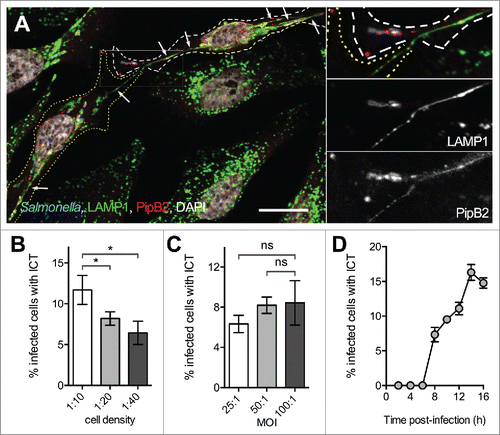
Figure 1. Observation of inter-cellular tubules (ICT). (A) HeLa cells were infected with wild-type Salmonella expressing CFP and PipB2-2HA. Cells were fixed at 16 h p.i., immunostained for LAMP-1 and HA, and imaged by confocal microscopy for CFP (blue), LAMP1 (green), HA (red) and nuclei (white). White and yellow dotted lines delineate 2 neighboring Salmonella-infected cells. Magnified insets in 4 colors or showing grayscale images for LAMP1 and PipB2 are presented. A LAMP1- and PipB2-positive Salmonella-induced tubule emerges from one cell and is in continuity with a similar tubule present in the adjacent cell. Arrows point Salmonella-induced tubules. Bar, 20 µm or 10 µm for the magnified insets. (B) Influence of the cell density on the formation of ICTs. HeLa cells were seeded at various surface ratio and infected 24 h later with GFP-expressing wild-type Salmonella at a MOI of 100:1. Cells were fixed at 16 h p.i. (C) Influence of the multiplicity of infection (MOI) on the formation of ICTs. HeLa cells were seeded at a surface ratio of 1:10 and infected 24 h later with various MOI of GFP-expressing wild-type Salmonella. Cells were fixed at 16 h p.i. (D) Kinetics of formation of ICTs. HeLa cells were seeded at a surface ratio of 1:10 and infected 24 h later with GFP-expressing wild-type Salmonella at a MOI of 100:1. Cells were fixed at different times p.i. (B - D) Infected cells presenting ICTs were enumerated by fluorescence microscopy. Data are the mean ± SD or representative (D) of 3 independent experiments. (B & C) Multiple t-tests were used to compare the mean values.

Figure 2. ICTs form between cytokinetic cells. (A) ICTs do not exist between cells that have been infected independently. Schematic representation of the experiment. HeLa cells were infected with GFP- or DsRed-expressing Salmonella. Cells of the 2 independent groups were trypsinized at 3 h p.i., mixed and co-cultured. Cells were fixed at 14 h p.i. and immunostained for LAMP-1. ICTs (blue line) were observed by fluorescence microscopy. ICTs were not observed between cells containing Salmonella not expressing the same color protein (redcross) (B) Salmonella-infected cells continue their progression through the cell cycle. HeLa cells were mock-infected (Ctrl) or infected with Salmonella for 14 h, DNA stained with propidium iodide and analyzed by flow cytometry. Mock-infected cells and the 2 populations of infected (GFP positive) and non-infected (GFP negative) cells were analyzed for their DNA content. Results are the means ± SD of 3 independent experiments. Multiple t-tests were used to compare the mean values. (C) Nocodazole treatment arrests cells in G2/M phase. HeLa cells were treated with nocodazole (0.4 µg / ml for 16 h) or left untreated, DNA stained with propidium iodide and analyzed by flow cytometry. FlowJo 8.3 was used to delineate population (green curves) on histogram plots and to quantify the percentage of cells with 2N (G1), 2 to 4N (S), and 4N (G2/M) DNA content. (D) Formation of ICTs and entry in G1 phase are concomitant. HeLa cells were infected with wild-type Salmonella expressing GFP for 6.5 h and further treated with nocodazole (0.4 µg / ml) for 12h. Cells were fixed at different times post nocodazole washout and stained with propidium iodide for flow cytometry analysis or immunostained for LAMP1. The percentages of infected cells in G1 phase (blue line) or with ICT (green line) are plotted function of time post-washout. Results presented in (C, D) are representative of 3 independent experiments. (E) ICTs pass through the midbody of cytokinetic Salmonella-infected cells. HeLa cells were infected with GFP-expressing Salmonella for 14 h, fixed, immunostained for AIM-1 and LAMP1. Cells were imaged for GFP (yellow), LAMP1 (red), AIM-1 (green) and DAPI (blue) using confocal microscopy. Magnified insets showing single labeling for LAMP1 and AIM-1 are presented on the right. White dotted lines delineate 2 Salmonella-infected daughter cells at the end of the cytokinesis process. Bar, 20 µm or 10 µm for the magnified insets.
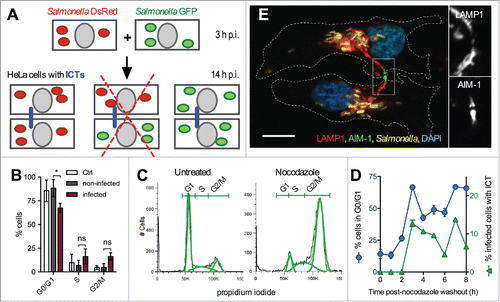
Figure 2. ICTs form between cytokinetic cells. (A) ICTs do not exist between cells that have been infected independently. Schematic representation of the experiment. HeLa cells were infected with GFP- or DsRed-expressing Salmonella. Cells of the 2 independent groups were trypsinized at 3 h p.i., mixed and co-cultured. Cells were fixed at 14 h p.i. and immunostained for LAMP-1. ICTs (blue line) were observed by fluorescence microscopy. ICTs were not observed between cells containing Salmonella not expressing the same color protein (redcross) (B) Salmonella-infected cells continue their progression through the cell cycle. HeLa cells were mock-infected (Ctrl) or infected with Salmonella for 14 h, DNA stained with propidium iodide and analyzed by flow cytometry. Mock-infected cells and the 2 populations of infected (GFP positive) and non-infected (GFP negative) cells were analyzed for their DNA content. Results are the means ± SD of 3 independent experiments. Multiple t-tests were used to compare the mean values. (C) Nocodazole treatment arrests cells in G2/M phase. HeLa cells were treated with nocodazole (0.4 µg / ml for 16 h) or left untreated, DNA stained with propidium iodide and analyzed by flow cytometry. FlowJo 8.3 was used to delineate population (green curves) on histogram plots and to quantify the percentage of cells with 2N (G1), 2 to 4N (S), and 4N (G2/M) DNA content. (D) Formation of ICTs and entry in G1 phase are concomitant. HeLa cells were infected with wild-type Salmonella expressing GFP for 6.5 h and further treated with nocodazole (0.4 µg / ml) for 12h. Cells were fixed at different times post nocodazole washout and stained with propidium iodide for flow cytometry analysis or immunostained for LAMP1. The percentages of infected cells in G1 phase (blue line) or with ICT (green line) are plotted function of time post-washout. Results presented in (C, D) are representative of 3 independent experiments. (E) ICTs pass through the midbody of cytokinetic Salmonella-infected cells. HeLa cells were infected with GFP-expressing Salmonella for 14 h, fixed, immunostained for AIM-1 and LAMP1. Cells were imaged for GFP (yellow), LAMP1 (red), AIM-1 (green) and DAPI (blue) using confocal microscopy. Magnified insets showing single labeling for LAMP1 and AIM-1 are presented on the right. White dotted lines delineate 2 Salmonella-infected daughter cells at the end of the cytokinesis process. Bar, 20 µm or 10 µm for the magnified insets.

Figure 3. Cell cycle analysis of Salmonella-infected RAW 264.7 macrophages. (A) Salmonella-infected RAW 264.7 macrophages undergo mitosis. RAW 264.7 macrophages were infected with GFP-expressing wild-type Salmonella for 14 h. Fixed cells were immunostained for AIM-1 and imaged for GFP (green), AIM-1 (red), and DAPI (white) by confocal microscopy. Infected macrophages divide and bacteria are distributed in both daughters (left image) or remain all in one of the daughters (right image). Bar, 10 µm. (B) Kinetic analysis of infected vs. non-infected RAW 264.7 cell cycle. RAW 264.7 cells were incubated with GFP-expressing wild-type Salmonella, fixed at different time points, DNA stained with propidium iodide and analyzed by flow cytometry (t = 0 corresponds to non-infected cells, t = 30 min corresponds to the end of the incubation period with bacteria). GPF fluorescence was used to define the gates corresponding to infected and non-infected cell populations. For each time point, the ratio between the percentages of Salmonella-infected versus non-infected cells in each phase of cell cycle was determined. Data (mean) are from 3 independent experiments. A two-way ANOVA test was used to determine whether a mean value was significantly different from one. Significant P values are indicated: *, P<0.05; **, P<0.01; ***, P<0.001. (C) Percentages of infected and non-infected RAW 264.7 cell in G0/G1, S and G2/M phases 14 h p.i. Data (mean ± SD) are from 3 independent experiments. Multiple t-tests were used to compare the mean values. P values: ns, not significant. (D) Salmonella are preferentially phagocytosed by pre-mitotic or mitotic RAW 264.7 cells. RAW 264.7 cells were incubated in the presence of fluorescent beads (Fluoresbrite® YG), heat-killed Salmonella (HK WT) or GFP-expressing bacteria (E. coli, or wild-type (WT), ΔprgH or ΔssaV Salmonella strains) for 30 minutes to allow phagocytosis. Cells were fixed and DNA stained with propidium iodide. For heat killed Salmonella, cells were immunostained for LPS. Normalized data were calculated by the ratio between the percentages of particle-containing vs. control cells in each phase of cell cycle. Data (mean ± SD) are from 5 to 9 independent experiments. A one-sample t-test was used to determine whether a mean value was significantly different from one. Significant P values are indicated: *, P<0.05; **, P<0.01.
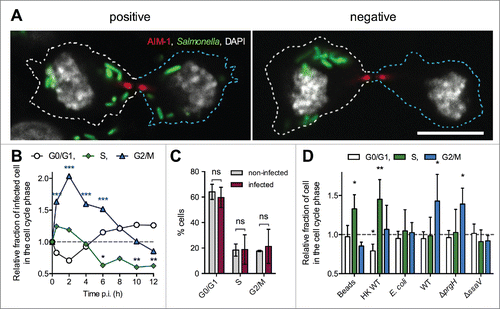
Figure 3. Cell cycle analysis of Salmonella-infected RAW 264.7 macrophages. (A) Salmonella-infected RAW 264.7 macrophages undergo mitosis. RAW 264.7 macrophages were infected with GFP-expressing wild-type Salmonella for 14 h. Fixed cells were immunostained for AIM-1 and imaged for GFP (green), AIM-1 (red), and DAPI (white) by confocal microscopy. Infected macrophages divide and bacteria are distributed in both daughters (left image) or remain all in one of the daughters (right image). Bar, 10 µm. (B) Kinetic analysis of infected vs. non-infected RAW 264.7 cell cycle. RAW 264.7 cells were incubated with GFP-expressing wild-type Salmonella, fixed at different time points, DNA stained with propidium iodide and analyzed by flow cytometry (t = 0 corresponds to non-infected cells, t = 30 min corresponds to the end of the incubation period with bacteria). GPF fluorescence was used to define the gates corresponding to infected and non-infected cell populations. For each time point, the ratio between the percentages of Salmonella-infected versus non-infected cells in each phase of cell cycle was determined. Data (mean) are from 3 independent experiments. A two-way ANOVA test was used to determine whether a mean value was significantly different from one. Significant P values are indicated: *, P<0.05; **, P<0.01; ***, P<0.001. (C) Percentages of infected and non-infected RAW 264.7 cell in G0/G1, S and G2/M phases 14 h p.i. Data (mean ± SD) are from 3 independent experiments. Multiple t-tests were used to compare the mean values. P values: ns, not significant. (D) Salmonella are preferentially phagocytosed by pre-mitotic or mitotic RAW 264.7 cells. RAW 264.7 cells were incubated in the presence of fluorescent beads (Fluoresbrite® YG), heat-killed Salmonella (HK WT) or GFP-expressing bacteria (E. coli, or wild-type (WT), ΔprgH or ΔssaV Salmonella strains) for 30 minutes to allow phagocytosis. Cells were fixed and DNA stained with propidium iodide. For heat killed Salmonella, cells were immunostained for LPS. Normalized data were calculated by the ratio between the percentages of particle-containing vs. control cells in each phase of cell cycle. Data (mean ± SD) are from 5 to 9 independent experiments. A one-sample t-test was used to determine whether a mean value was significantly different from one. Significant P values are indicated: *, P<0.05; **, P<0.01.

Figure 4. Distribution of Salmonella in cytokinetic cells. (A) Salmonella are diversely distributed in daughter cells during cytokinesis. HeLa cells were infected with CFP-expressing Salmonella for 14h, fixed, immunostained for LAMP1 and imaged for CFP (green), LAMP1 (red), and DAPI (blue) using confocal microscopy. Grayscale images showing single labeling for bacteria (CFP) are shown. Cytokinetic cells with different distribution of bacteria in daughters are presented. In the right images, bacteria are found in only one of the daughter cells. Cytokinesis was categorized as "negative." The left images present cytokinetic figures with bacteria in both daughters (categorized as "positive"). If one of the daughter cells contained up to 2/3 of total bacteria, the cytokinesis was categorized as "balanced." If one of the daughter cells contained more than 2/3 of total bacteria, the cytokinesis was categorized as "unbalanced." Bar, 20 µm (B - D) Influence of T3SS-2 effectors on the distribution of Salmonella in daughter cells. Cells were infected with GFP- and PipB2-2HA-expressing bacteria, fixed 14 h p.i. and stained for HA, AIM-1 and nuclei. (B) HeLa cells. For each strain, "positive" cytokinesis cells were plotted as a function of cells with ICTs. One-way ANOVA with Dunnett's post-test was used to compare the mean of positive cytokinesis of mutant strains with those of wild-type Salmonella. (C) RAW 264.7 cells. The fractions of "positive" cytokinesis in RAW 264.7 cells were determined for wild-type Salmonella and a selection of strains. (D) The fractions of cytokinetic HeLa and RAW 264.7 cells with a balanced distribution of bacteria were determined. (B - D) Data (mean ± SD) are from 3 to 6 independent experiments. (C - D) Unpaired t-tests were used to compare the mean of a strain with the mean of wild-type Salmonella or to compare the means of 2 strains. P values: ns, not significant; *, P<0.05; **, P<0.01; ***, P<0.001.
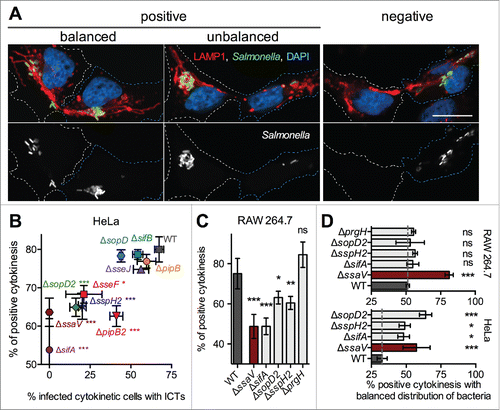
Figure 4. Distribution of Salmonella in cytokinetic cells. (A) Salmonella are diversely distributed in daughter cells during cytokinesis. HeLa cells were infected with CFP-expressing Salmonella for 14h, fixed, immunostained for LAMP1 and imaged for CFP (green), LAMP1 (red), and DAPI (blue) using confocal microscopy. Grayscale images showing single labeling for bacteria (CFP) are shown. Cytokinetic cells with different distribution of bacteria in daughters are presented. In the right images, bacteria are found in only one of the daughter cells. Cytokinesis was categorized as "negative." The left images present cytokinetic figures with bacteria in both daughters (categorized as "positive"). If one of the daughter cells contained up to 2/3 of total bacteria, the cytokinesis was categorized as "balanced." If one of the daughter cells contained more than 2/3 of total bacteria, the cytokinesis was categorized as "unbalanced." Bar, 20 µm (B - D) Influence of T3SS-2 effectors on the distribution of Salmonella in daughter cells. Cells were infected with GFP- and PipB2-2HA-expressing bacteria, fixed 14 h p.i. and stained for HA, AIM-1 and nuclei. (B) HeLa cells. For each strain, "positive" cytokinesis cells were plotted as a function of cells with ICTs. One-way ANOVA with Dunnett's post-test was used to compare the mean of positive cytokinesis of mutant strains with those of wild-type Salmonella. (C) RAW 264.7 cells. The fractions of "positive" cytokinesis in RAW 264.7 cells were determined for wild-type Salmonella and a selection of strains. (D) The fractions of cytokinetic HeLa and RAW 264.7 cells with a balanced distribution of bacteria were determined. (B - D) Data (mean ± SD) are from 3 to 6 independent experiments. (C - D) Unpaired t-tests were used to compare the mean of a strain with the mean of wild-type Salmonella or to compare the means of 2 strains. P values: ns, not significant; *, P<0.05; **, P<0.01; ***, P<0.001.

Table 1. Salmonella strains.

Supplemental material

KVIR_S__1173298.docx

Download MS Word (8.7 MB)