1,904
Views
17
CrossRef citations to date
0
Altmetric
Research Paper

Enhanced detection of respiratory pathogens with nanotrap particles

, , , , , , , & show all
Pages 756-769 | Received 11 Jan 2016, Accepted 27 Apr 2016, Published online: 25 May 2016

Figures & data

Figure 1. Nanotrap particles captured Influenza A virions. One milliliter of Influenza A/California/4/2009 (IA H1N1), Influenza A/Brisbane/10/2007 (IA H3N2), or Influenza B/Taiwan/2/62 (Influenza B) were diluted to 1E+05 pfu/mL in PBS and incubated with 100 µL NT45, NT46, NT53, NT55, or NT69 for 30 minutes at room temperature. Samples were centrifuged, unbound material removed, and the pellet was washed one time with 200 µL distilled water and incubated for an additional 15 minutes. Samples were then centrifuged and unbound material was discarded. Samples were processed for qRT-PCR (panels A-C) or plaque assays (panels D-F). No NT samples (at 100 µL volumes) were processed in parallel.
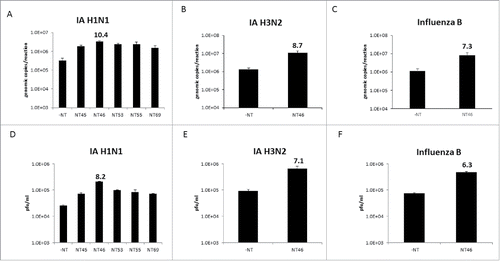
Figure 1. Nanotrap particles captured Influenza A virions. One milliliter of Influenza A/California/4/2009 (IA H1N1), Influenza A/Brisbane/10/2007 (IA H3N2), or Influenza B/Taiwan/2/62 (Influenza B) were diluted to 1E+05 pfu/mL in PBS and incubated with 100 µL NT45, NT46, NT53, NT55, or NT69 for 30 minutes at room temperature. Samples were centrifuged, unbound material removed, and the pellet was washed one time with 200 µL distilled water and incubated for an additional 15 minutes. Samples were then centrifuged and unbound material was discarded. Samples were processed for qRT-PCR (panels A-C) or plaque assays (panels D-F). No NT samples (at 100 µL volumes) were processed in parallel.

Table 1. Nanotrap particle bait and shell chemistries.

Figure 2. Nanotrap particles enhanced detection of Influenza hemagglutinin proteins. (A) One mL of histidine-tagged hemagglutinin protein (His-HA) from IA H1N1 (1 µg/mL) was incubated with 100 µL NT45, NT46, NT53, NT55, or NT69 for 30 minutes at room temperature. (B) IA H1N1 His-HA (1 µg/mL, 100 ng/mL, or 10 ng/mL) was incubated with 100 µL NT46 for 30 minutes at room temperature. (C) His-HA proteins (1 µg/mL) from H1N1, H5N1, or H5N8 were incubated with 100 µL NT46 for 30 minutes at room temperature. (D) His-HA proteins (1 µg/mL) from H1N1, H7N2, and H7N7 were incubated with 100 µL NT46 for 30 minutes at room temperature. Samples in panels A-D were analyzed for the presence of Influenza HA by western blot using antibodies directed against the histidine tag. Control samples are His-HA at 100 μg/mL and/or 10 μg/mL (panels C and D) and a no NT (1 μg/mL of His-HA) sample at a volume of 10 µL processed in parallel.
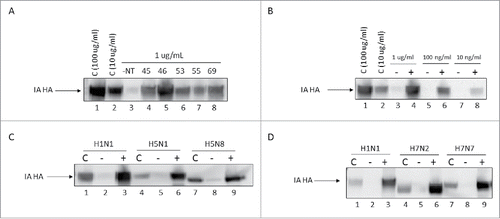
Figure 2. Nanotrap particles enhanced detection of Influenza hemagglutinin proteins. (A) One mL of histidine-tagged hemagglutinin protein (His-HA) from IA H1N1 (1 µg/mL) was incubated with 100 µL NT45, NT46, NT53, NT55, or NT69 for 30 minutes at room temperature. (B) IA H1N1 His-HA (1 µg/mL, 100 ng/mL, or 10 ng/mL) was incubated with 100 µL NT46 for 30 minutes at room temperature. (C) His-HA proteins (1 µg/mL) from H1N1, H5N1, or H5N8 were incubated with 100 µL NT46 for 30 minutes at room temperature. (D) His-HA proteins (1 µg/mL) from H1N1, H7N2, and H7N7 were incubated with 100 µL NT46 for 30 minutes at room temperature. Samples in panels A-D were analyzed for the presence of Influenza HA by western blot using antibodies directed against the histidine tag. Control samples are His-HA at 100 μg/mL and/or 10 μg/mL (panels C and D) and a no NT (1 μg/mL of His-HA) sample at a volume of 10 µL processed in parallel.

Figure 3. Nanotrap particles enhanced detection of Influenza in clinically relevant matrices. (A) IA H1N1 was diluted to 1E+05 pfu/mL in PBS and incubated with NT46, NT46 with an outer shell (NT46S), or NT46 with an outer shell coated with VSA (NT46V). Samples were processed for qRT- PCR as described in . No NT samples (at 100 µL volumes) were processed in parallel. (B) For the nasal wash samples, IA H1N1 was diluted to 1E+05 pfu/mL in 10% human nasal fluid and incubated with NT46 or NT46V. For the nasal swab samples, Influenza A/California/4/2009 was diluted to 1E+06 pfu/mL in 100% human nasal fluid and spiked onto a flocked swab. The swab was swirled in 1 mL PBS, the swab head was cut and placed in a spin basket on top of the microcentrifuge tube containing the sample, and centrifuged at 14,000 rpm for 5 minutes. The swab head and spin basket were removed, the sample transferred to a new microcentrifuge tube, and 100 µL of NT46 or NT46V was added to each sample. Samples were processed for qRT-PCR as described in . No NT samples (at 100 µL volumes) were processed in parallel. Statistical significance for panels A and B were determined through one-way ANOVA followed by Tukey's multiple comparisons test: *p-value < 0 .05, **p-value ≤ 0 .01, and ***p-value ≤ 0 .001. n.s. is not significant. Samples were compared to the –NT sample (significant of comparison indicated without brackets) and to each other (significance of comparison indicated with brackets). C) IA H1N1 was diluted to 1E+05 pfu/mL in 10% human saliva from three different donors and incubated with NT46. Samples were processed for qRT-PCR as described in . No NT samples (at 100 µL volumes) were processed in parallel. D) IA H1N1 was diluted to 1E+05 pfu/mL in 100% human saliva from a single donor and incubated with NT46. Samples were processed for qRT-PCR as described in . No NT samples (at 100 µL volumes) were processed in parallel. Statistical significance for panels C and D were determined through student's t-tests: ***p-value ≤ 0 .001, ****p-value < 0 .0001 (compared to the –NT sample).
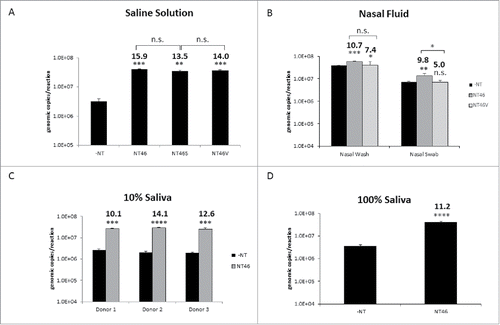
Figure 3. Nanotrap particles enhanced detection of Influenza in clinically relevant matrices. (A) IA H1N1 was diluted to 1E+05 pfu/mL in PBS and incubated with NT46, NT46 with an outer shell (NT46S), or NT46 with an outer shell coated with VSA (NT46V). Samples were processed for qRT- PCR as described in Figure 1. No NT samples (at 100 µL volumes) were processed in parallel. (B) For the nasal wash samples, IA H1N1 was diluted to 1E+05 pfu/mL in 10% human nasal fluid and incubated with NT46 or NT46V. For the nasal swab samples, Influenza A/California/4/2009 was diluted to 1E+06 pfu/mL in 100% human nasal fluid and spiked onto a flocked swab. The swab was swirled in 1 mL PBS, the swab head was cut and placed in a spin basket on top of the microcentrifuge tube containing the sample, and centrifuged at 14,000 rpm for 5 minutes. The swab head and spin basket were removed, the sample transferred to a new microcentrifuge tube, and 100 µL of NT46 or NT46V was added to each sample. Samples were processed for qRT-PCR as described in Figure 1. No NT samples (at 100 µL volumes) were processed in parallel. Statistical significance for panels A and B were determined through one-way ANOVA followed by Tukey's multiple comparisons test: *p-value < 0 .05, **p-value ≤ 0 .01, and ***p-value ≤ 0 .001. n.s. is not significant. Samples were compared to the –NT sample (significant of comparison indicated without brackets) and to each other (significance of comparison indicated with brackets). C) IA H1N1 was diluted to 1E+05 pfu/mL in 10% human saliva from three different donors and incubated with NT46. Samples were processed for qRT-PCR as described in Figure 1. No NT samples (at 100 µL volumes) were processed in parallel. D) IA H1N1 was diluted to 1E+05 pfu/mL in 100% human saliva from a single donor and incubated with NT46. Samples were processed for qRT-PCR as described in Figure 1. No NT samples (at 100 µL volumes) were processed in parallel. Statistical significance for panels C and D were determined through student's t-tests: ***p-value ≤ 0 .001, ****p-value < 0 .0001 (compared to the –NT sample).

Figure 4. Nanotrap particles enhanced detection of Influenza at both high and low titers. A-C) IA H1N1 was diluted from 1E+05 pfu/mL to 1E+01 pfu/ml in saline (panel A), 1E+05 pfu/mL to 1E+01 pfu/ml in nasal wash (panel B), or 1E+05 pfu/mL to 1E+00 pfu/ml in 10% human saliva (panel C) and incubated with NT46. Samples were processed for qRT-PCR as described in . No NT samples (at 100 µL volumes) were processed in parallel. D and E) IA H1N1 was diluted from 7.5E+05 pfu/ml to 7.5E+02 pfu/ml in saline solution (panel D) or diluted from 2.0E+04 pfu/mL to 2.0E+02 pfu/ml in 10% human saliva (panel E) and incubated with NT46. Samples were processed for plaque assay as described in . No NT samples (at 100 µL volumes) were processed in parallel. Statistical significance for all panels was determined through student's t-tests: *p-value ≤ 0 .05, **p-value ≤ 0 .01, **p-value ≤ 0 .01, ****p-value ≤ 0 .0001, and n.s is not significant (compared to the –NT sample). Dashed lines represent the lower LOD for the assays, which is 100 genomic copies/reaction for IA H1N1 qRT-PCR and 2E+01 pfu/ml for the plaque assays.
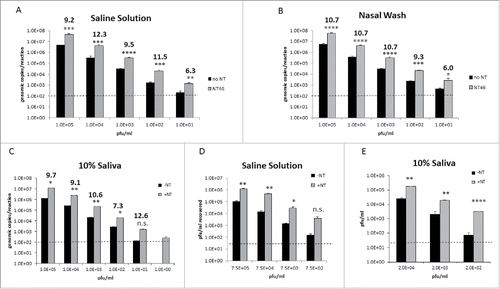
Figure 4. Nanotrap particles enhanced detection of Influenza at both high and low titers. A-C) IA H1N1 was diluted from 1E+05 pfu/mL to 1E+01 pfu/ml in saline (panel A), 1E+05 pfu/mL to 1E+01 pfu/ml in nasal wash (panel B), or 1E+05 pfu/mL to 1E+00 pfu/ml in 10% human saliva (panel C) and incubated with NT46. Samples were processed for qRT-PCR as described in Figure 1. No NT samples (at 100 µL volumes) were processed in parallel. D and E) IA H1N1 was diluted from 7.5E+05 pfu/ml to 7.5E+02 pfu/ml in saline solution (panel D) or diluted from 2.0E+04 pfu/mL to 2.0E+02 pfu/ml in 10% human saliva (panel E) and incubated with NT46. Samples were processed for plaque assay as described in Figure 1. No NT samples (at 100 µL volumes) were processed in parallel. Statistical significance for all panels was determined through student's t-tests: *p-value ≤ 0 .05, **p-value ≤ 0 .01, **p-value ≤ 0 .01, ****p-value ≤ 0 .0001, and n.s is not significant (compared to the –NT sample). Dashed lines represent the lower LOD for the assays, which is 100 genomic copies/reaction for IA H1N1 qRT-PCR and 2E+01 pfu/ml for the plaque assays.

Figure 5. Nanotrap particles captured other respiratory viral pathogens. One ml of respiratory syncytial virus (RSV) diluted to 1E+05 genomic copies/5 µL (panel A) or coronavirus (CoV) strain 229E diluted to 1E+05 genomic copies/5 µL (panel B) were added to 100 µL NT45, NT46, NT53, NT55, or NT69. Samples were processed for qRT-PCR as described in . No NT samples (at 100 µL volumes) were processed in parallel. Statistical significance was determined through one-way ANOVA followed by Tukey's multiple comparisons test: *p-value < 0 .05, ***p-value ≤ 0 .001, and ****p-value < 0 .0001 (compared to the –NT sample). n.s. is not significant.

Figure 5. Nanotrap particles captured other respiratory viral pathogens. One ml of respiratory syncytial virus (RSV) diluted to 1E+05 genomic copies/5 µL (panel A) or coronavirus (CoV) strain 229E diluted to 1E+05 genomic copies/5 µL (panel B) were added to 100 µL NT45, NT46, NT53, NT55, or NT69. Samples were processed for qRT-PCR as described in Figure 1. No NT samples (at 100 µL volumes) were processed in parallel. Statistical significance was determined through one-way ANOVA followed by Tukey's multiple comparisons test: *p-value < 0 .05, ***p-value ≤ 0 .001, and ****p-value < 0 .0001 (compared to the –NT sample). n.s. is not significant.

Figure 6. Nanotrap particles captured multiple viruses in one sample. (A) Influenza A/California/4/2009 (IA H1N1), Influenza A/Brisbane/10/2007 (IA H3N2), or a combination of the 2 viruses were diluted to 1E+05 pfu/mL in PBS and incubated with NT46. B) IA H1N1, Influenza B/Taiwan/2/62 (IB), or a combination of the two viruses were diluted to 1E+05 pfu/mL in PBS and incubated with NT46. (C) IA H1N1, CoV 229E strain, or a combination of the two viruses were diluted to 1E+05 pfu/mL (for IA) or 1E+05 genomic copies/5µL (for CoV) in PBS and incubated with NT46. (D) IA H1N1, RSV A2 strain, or a combination of the two viruses were diluted to 1E+05 pfu/mL (for IA H1N1) or 1E+05 genomic copies/5µL (for RSV) in PBS and incubated with NT46. Samples were processed and analyzed for qRT PCR with viral-specific primers as described in . No NT samples (at 100 µL volumes) were processed in parallel. Fold enrichment values for NT46 samples are shown. Statistical significance was determined through student's t- tests: **p-value ≤ 0 .01 (compared to the –NT sample), n.s. is not significant.
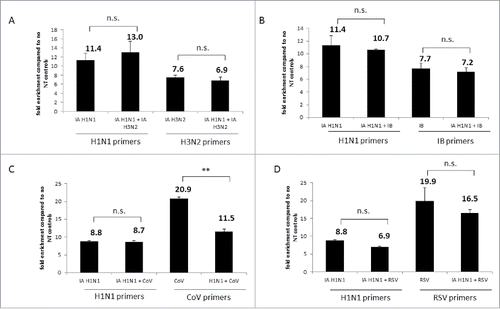
Figure 6. Nanotrap particles captured multiple viruses in one sample. (A) Influenza A/California/4/2009 (IA H1N1), Influenza A/Brisbane/10/2007 (IA H3N2), or a combination of the 2 viruses were diluted to 1E+05 pfu/mL in PBS and incubated with NT46. B) IA H1N1, Influenza B/Taiwan/2/62 (IB), or a combination of the two viruses were diluted to 1E+05 pfu/mL in PBS and incubated with NT46. (C) IA H1N1, CoV 229E strain, or a combination of the two viruses were diluted to 1E+05 pfu/mL (for IA) or 1E+05 genomic copies/5µL (for CoV) in PBS and incubated with NT46. (D) IA H1N1, RSV A2 strain, or a combination of the two viruses were diluted to 1E+05 pfu/mL (for IA H1N1) or 1E+05 genomic copies/5µL (for RSV) in PBS and incubated with NT46. Samples were processed and analyzed for qRT PCR with viral-specific primers as described in Figure 1. No NT samples (at 100 µL volumes) were processed in parallel. Fold enrichment values for NT46 samples are shown. Statistical significance was determined through student's t- tests: **p-value ≤ 0 .01 (compared to the –NT sample), n.s. is not significant.

Figure 7. Nanotrap particles enriched Influenza A after five minutes of incubation. One milliliter of IA H1N1 was diluted to 1E+05 pfu/mL in PBS and incubated with 100 µL NT46 from 5 minutes to 30 minutes at room temperature. Samples were processed for qRT-PCR (panel A) or plaque assays (panel B) as described in . No NT samples (at 100 µL volumes) were processed in parallel.
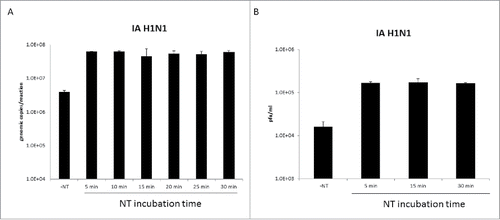
Figure 7. Nanotrap particles enriched Influenza A after five minutes of incubation. One milliliter of IA H1N1 was diluted to 1E+05 pfu/mL in PBS and incubated with 100 µL NT46 from 5 minutes to 30 minutes at room temperature. Samples were processed for qRT-PCR (panel A) or plaque assays (panel B) as described in Figure 1. No NT samples (at 100 µL volumes) were processed in parallel.
Supplemental material

KVIR_S_1185585_Supplemental.zip

Download Zip (155 KB)

Reprints and Corporate Permissions

Please note: Selecting permissions does not provide access to the full text of the article, please see our help page How do I view content?

To request a reprint or corporate permissions for this article, please click on the relevant link below:

Academic Permissions

Please note: Selecting permissions does not provide access to the full text of the article, please see our help page How do I view content?

Obtain permissions instantly via Rightslink by clicking on the button below:

If you are unable to obtain permissions via Rightslink, please complete and submit this Permissions form. For more information, please visit our Permissions help page.