2,161
Views
12
CrossRef citations to date
0
Altmetric
Research Paper

Invasive behavior of Campylobacter jejuni in immunosuppressed chicken

, , , , &
Pages 248-260 | Received 19 Jan 2016, Accepted 03 Aug 2016, Published online: 30 Aug 2016

Figures & data

Figure 1. C. jejuni and S. Enteritidis colonization kinetics in GC-treated and control chickens. Chicken were injected with GC (closed blocks) or PBS (open circles) and 24 h later challenged orally with 105 CFU of C. jejuni or S. Enteritidis. At Day 1–4 post-challenge, C. jejuni (panel A) and S. Enteritidis (panel B) colonization of the ceca and the liver was estimated by CFU counting. Data are plotted as CFU per gram of cecal content or liver tissue for each chicken and expressed as the geometric mean (horizontal bars) of CFU per group of chicken. Statistical analysis of differences between treated and non-treated chickens were calculated with a gamma generalized linear model and gave the following values: Campylobacter in the ceca: β = 0.56, 95%CI 0.26–0.86, p < 0.001; Campylobacter in the liver: β = 0.46, 95%CI 0.13–0.79, p = 0.007; Salmonella in the ceca: β = 0.10, 95%CI 0.01–0.19, p = 0.033; Salmonella in the liver: β = 0.75, 95%CI 0.47–1.02, p < 0.001.
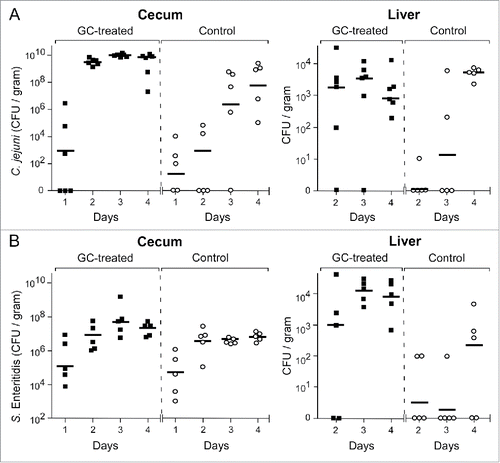
Figure 1. C. jejuni and S. Enteritidis colonization kinetics in GC-treated and control chickens. Chicken were injected with GC (closed blocks) or PBS (open circles) and 24 h later challenged orally with 105 CFU of C. jejuni or S. Enteritidis. At Day 1–4 post-challenge, C. jejuni (panel A) and S. Enteritidis (panel B) colonization of the ceca and the liver was estimated by CFU counting. Data are plotted as CFU per gram of cecal content or liver tissue for each chicken and expressed as the geometric mean (horizontal bars) of CFU per group of chicken. Statistical analysis of differences between treated and non-treated chickens were calculated with a gamma generalized linear model and gave the following values: Campylobacter in the ceca: β = 0.56, 95%CI 0.26–0.86, p < 0.001; Campylobacter in the liver: β = 0.46, 95%CI 0.13–0.79, p = 0.007; Salmonella in the ceca: β = 0.10, 95%CI 0.01–0.19, p = 0.033; Salmonella in the liver: β = 0.75, 95%CI 0.47–1.02, p < 0.001.

Figure 2. Effect of C. jejuni and S. Enteritidis colonization on cytokine mRNA levels. Transcript levels for the indicated cytokines were determined in cecal mucosa and spleen tissue isolated from individual birds at Day 1 and 4 after challenge with C. jejuni (panels A and B) or S. Enteritidis (panels C and D). RT-qPCR results were expressed as fold difference between the average mRNA levels in the indicated tissues of challenged chicken compared to (PBS-injected) control birds. Significant differences in ΔmRNA values were analyzed using log transformed data as described in Materials and Methods. Significant differences are indicated: **P < 0.005; *P < 0.05.
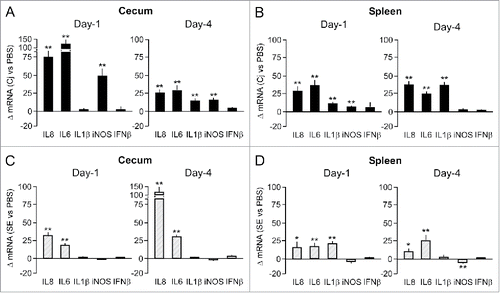
Figure 2. Effect of C. jejuni and S. Enteritidis colonization on cytokine mRNA levels. Transcript levels for the indicated cytokines were determined in cecal mucosa and spleen tissue isolated from individual birds at Day 1 and 4 after challenge with C. jejuni (panels A and B) or S. Enteritidis (panels C and D). RT-qPCR results were expressed as fold difference between the average mRNA levels in the indicated tissues of challenged chicken compared to (PBS-injected) control birds. Significant differences in ΔmRNA values were analyzed using log transformed data as described in Materials and Methods. Significant differences are indicated: **P < 0.005; *P < 0.05.
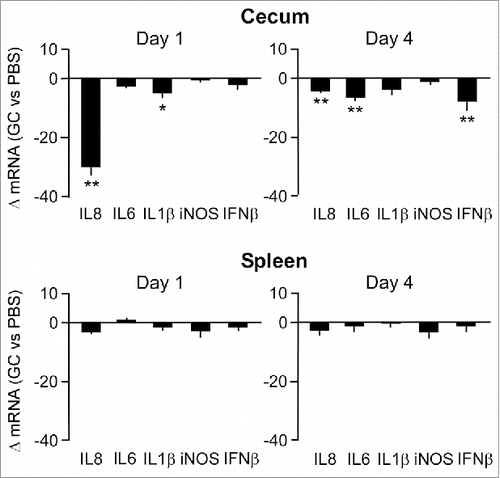
Figure 3. Effect of GC treatment on inflammatory gene expression in cecal mucosa and spleen tissue. Transcript levels of the indicated genes at Day 1 and 4 after injection of chicken with GC or PBS were determined by real-time RT-qPCR. Results are expressed as the mean ± SEM fold difference in tissue mRNA levels in the GC-treated vs. control animals. Significant differences in ΔmRNA values were analyzed using log transformed data as described in Materials and Methods. Significant differences are indicated: **P < 0.005; *P < 0.05.
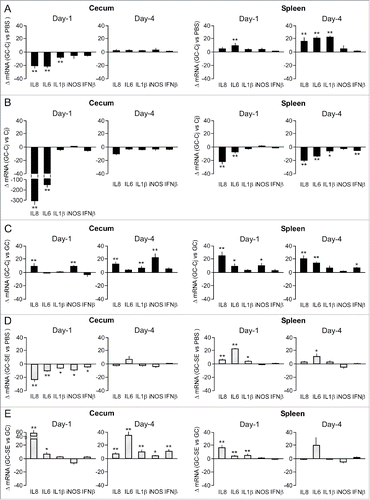
Figure 3. Effect of GC treatment on inflammatory gene expression in cecal mucosa and spleen tissue. Transcript levels of the indicated genes at Day 1 and 4 after injection of chicken with GC or PBS were determined by real-time RT-qPCR. Results are expressed as the mean ± SEM fold difference in tissue mRNA levels in the GC-treated vs. control animals. Significant differences in ΔmRNA values were analyzed using log transformed data as described in Materials and Methods. Significant differences are indicated: **P < 0.005; *P < 0.05.

Figure 4. Effect of the combination of GC treatment plus challenge with C. jejuni or S. Enteritidis on inflammatory gene expression. Chicken were injected with GC or PBS and after 24 h challenged with C. jejuni (panels A and C) or S. Enteritidis (panels D and E). Real-time RT-qPCR was performed on mRNA isolated from cecal mucosa and spleen tissue collected at Days 1 and 4 post-challenge. Results are expressed as the mean ± SEM fold difference in mRNA levels in GC-treated, treated and challenged chicken versus PBS-injected and non-challenged animals (panels A and D), PBS-injected and C. jejuni challenged chicken (panel B), or GC-treated and non-challenged chicken (panels C and E). Significant differences in ΔmRNA values were analyzed using log transformed data as described in Materials and Methods. Significant differences are indicated: **P < 0.005; *P < 0.05.

Figure 4. Effect of the combination of GC treatment plus challenge with C. jejuni or S. Enteritidis on inflammatory gene expression. Chicken were injected with GC or PBS and after 24 h challenged with C. jejuni (panels A and C) or S. Enteritidis (panels D and E). Real-time RT-qPCR was performed on mRNA isolated from cecal mucosa and spleen tissue collected at Days 1 and 4 post-challenge. Results are expressed as the mean ± SEM fold difference in mRNA levels in GC-treated, treated and challenged chicken versus PBS-injected and non-challenged animals (panels A and D), PBS-injected and C. jejuni challenged chicken (panel B), or GC-treated and non-challenged chicken (panels C and E). Significant differences in ΔmRNA values were analyzed using log transformed data as described in Materials and Methods. Significant differences are indicated: **P < 0.005; *P < 0.05.

Figure 5. Effect of GC-treatment gene TLR- and C. jejuni-induced gene transcription in chicken macrophages. (A) MQ-NCSU and HD11 cells pre-incubated (17 h) with or without dexamethasone were stimulated with LPS (100 ng/ml) or flagellin (FliC, 1 µg/ml) for 16 h or with live C. jejuni (2 × 10⁵) for 8 h. Then, real-time RT-qPCR was performed on mRNA isolated from the cells to measure differences in iNOS mRNA levels between the Dex-treated and control cells. (B) Fold difference in the indicated inflammatory gene transcript levels in the GC-treated and non-GC treated cells after stimulation with LPS (100 ng/ml, 16 h). All results are expressed as the mean ± SEM fold difference in the transcript levels between the Dex-treated ands control cells (n = 3). For each response significant differences between Dex-treated and control cells are indicated: **P < 0.001; *P < 0.05.
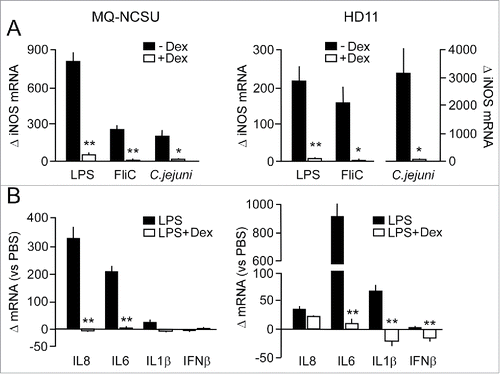
Figure 5. Effect of GC-treatment gene TLR- and C. jejuni-induced gene transcription in chicken macrophages. (A) MQ-NCSU and HD11 cells pre-incubated (17 h) with or without dexamethasone were stimulated with LPS (100 ng/ml) or flagellin (FliC, 1 µg/ml) for 16 h or with live C. jejuni (2 × 10⁵) for 8 h. Then, real-time RT-qPCR was performed on mRNA isolated from the cells to measure differences in iNOS mRNA levels between the Dex-treated and control cells. (B) Fold difference in the indicated inflammatory gene transcript levels in the GC-treated and non-GC treated cells after stimulation with LPS (100 ng/ml, 16 h). All results are expressed as the mean ± SEM fold difference in the transcript levels between the Dex-treated ands control cells (n = 3). For each response significant differences between Dex-treated and control cells are indicated: **P < 0.001; *P < 0.05.

Figure 6. Effect of GC treatment on LPS or flagellin-induced production of nitric oxide in chicken macrophages. NCSU and HD11 chicken macrophages were incubated with dexamethasone (Dex, 10−6 M) for 17 h and then stimulated with the indicated concentrations of LPS (A) or flagellin (FliC) (B). After 24 h of stimulation, NO production was measured using the Griess assay. Results are the mean ± SEM of 6 (A) and 4 (B) experiments. Significant differences in ligand-induced NO production between Dex-treated and control cells are indicated: **P < 0.005; *P < 0.05.
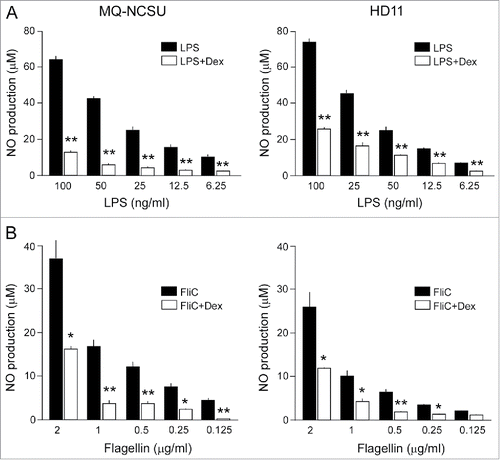
Figure 6. Effect of GC treatment on LPS or flagellin-induced production of nitric oxide in chicken macrophages. NCSU and HD11 chicken macrophages were incubated with dexamethasone (Dex, 10−6 M) for 17 h and then stimulated with the indicated concentrations of LPS (A) or flagellin (FliC) (B). After 24 h of stimulation, NO production was measured using the Griess assay. Results are the mean ± SEM of 6 (A) and 4 (B) experiments. Significant differences in ligand-induced NO production between Dex-treated and control cells are indicated: **P < 0.005; *P < 0.05.

Table 1. Primers and probes used in this study.