Figures & data
Table 1. Baseline characteristics of all the enrolled chronic hepatitis C patients.
Table 2. Univariate and multivariate analyses of factors associated with pre-therapy HOMA-IR and adiponectin levels in all 744 enrolled chronic hepatitis C patients.
Figure 1. The cross-sectional adiponectin and homeostasis model assessment-estimated insulin resistance (HOMA-IR)-centered associations between dependent and independent factors before (pre-therapy) and 24 weeks after anti-hepatitis (C)virus (anti-HCV) therapy (post-therapy). Tips of black arrowheads: dependent factors; bases of black arrowheads: independent factors; FL: fatty liver, i.e., hepatic steatosis; TGs: triglycerides; IR: insulin resistance; IFNL3: interferon, λ3; BMI: body mass index; APRI: aspartate aminotransferase to platelet ratio index; pre-therapy: levels of variables before anti-HCV therapy; SVR: sustained virological response. Red arrows indicate post-therapeutic increases in HOMA-IR (baseline IR = 0) levels, while blue arrows indicate post-therapeutic decreases in HOMA-IR (baseline IR = 1) and adiponectin levels.
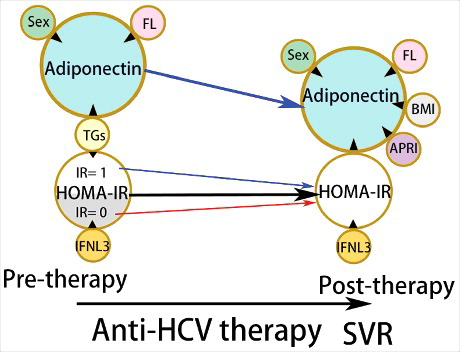
Figure 2. The longitudinal trends of adiponectin levels (μg/mL) and homeostasis model assessment-estimated insulin resistance (HOMA-IR). The trends were stratified by sex (A), steatosis (B) and SVR (C). Blood drawing time points: 1, 2 weeks before therapy; 2, after 4 weeks of therapy; 3, after 12 weeks of therapy; 4, after 24 weeks of therapy; 5, after 36 weeks of therapy; 6, after 48 weeks of therapy; 7, after 60 weeks of therapy; and 8, after 72 weeks of therapy. 1: yes (or male for A); 0: no. (or female for A) D-E, Alterations of levels of adiponectin (μg/mL) (D) and HOMA-IR (E) in SVR patients. Red lines: SVR patients with baseline IR; black lines: SVR patients without baseline IR. Pre-therapy: levels of variables before anti-hepatitis C virus therapy; post-therapy: levels of variables at 24 weeks post-therapy.
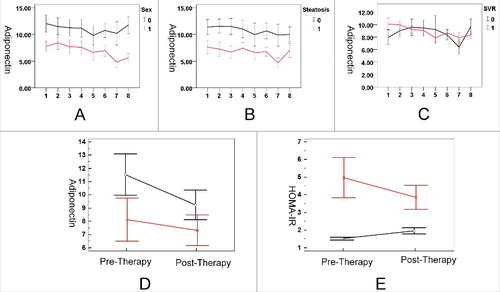
Table 3. Univariate and multivariate analyses of factors associated with post-therapy HOMA-IR and adiponectin levels in the 455 chronic hepatitis C patients with SVR.
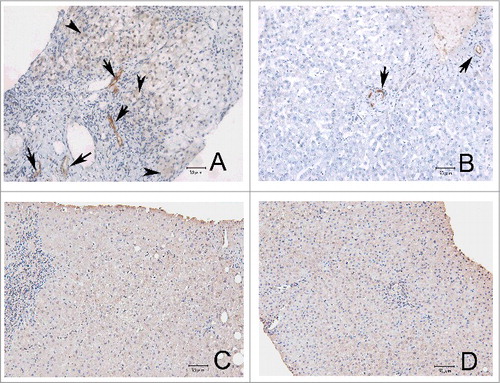
Figure 3. Immunohistochemical studies of adiponectin (A and B, 200X) and adiponectin receptor II (C and D, 200X) in representative liver's sections from chronic hepatitis C patients before anti-hepatitis C virus therapy (A and C) and in controls (B and D). Arrows: adiponectin-positive biliary and endothelial cells; arrow heads: adiponectin-positive hepatocytes.