Figures & data
Figure 1. Decreased bacterial loads via rapid DNA tattooing during experimental intranasal melioidosis. (A) Schematic overview of DNA vaccine designs based on B. pseudomallei flagellin (FliC), cloned into the pVAX1 vector. All vaccines are codon optimized and contain a Kozak sequence to optimize ribosomal binding. hTPA-FliC contains an N-terminal cellular secretion signal, FliC-KDEL contains a C-terminal endoplasmatic reticulum retention signal. (B) FliC-specific IgG induction in plasma after rapid tattoo vaccination at t = 0, 3 and 6 days (indicated by arrows). Bars represent mean ± SEM (C-F) Three weeks after the first vaccination, mice were inoculated intranasally with 200 CFU B. pseudomallei and sacrificed 72 hours later. Bacterial loads in lung (C), blood (D), liver (E) and spleen homogenate (F) are depicted as scatter dot plots with a line at the median (n = 8 mice per group). Numbers in the box below (D) indicate the number of positive blood cultures/total number of mice. The vaccinated groups were compared to the empty pVAX control group using a Mann-Whitney test. #p < 0.05, ##p < 0.01. For pVAX-hTPA-FliC vs. empty pVAX blood CFU a Chi-square test was performed (p = 0.007)
Figure 2. Decreased proinflammatory pulmonary and systemic cytokine levels in rapid DNA tattoo-vaccinated mice during experimental intranasal melioidosis. Mice were given rapid tattoo vaccination at t = 0, 3 and 6 days followed by intranasal bacterial challenge (200 CFU B. pseudomallei) on day 21. Mice were sacrificed 72 hours after intranasal B. pseudomallei challenge and heparinized blood plasma and lung homogenates were obtained. TNFα (A), IL-6 (B) and CXCL1 (C) were measured in lung homogenate; TNFα (D), IL-6 (E) and IFNγ (F) were measured in plasma. Values are in pg/mL; data are presented as box- and whisker plots showing the smallest observation, lower quartile, median, upper quartile and largest observation. N = 8 mice per group. Vaccinated groups were compared to the control group (empty pVAX) using a Mann Whitney test. #p < 0.05, ##p < 0.01, ###p < 0.001
Figure 3. A single intranasal vaccination with pVAX-hTPA-FliC is more effective in lowering bacterial loads than single tattoo administration during experimental intranasal melioidosis. A single dose of pVAX-hTPA-FliC was administered on day 0 either via tattoo or intranasally and compared with recombinant FliC + CFA s.c. as a positive control or empty pVAX tattoo as a negative control. All mice were inoculated intranasally with 300 CFU B. pseudomallei on day 21. (A) FliC-specific IgG in plasma at day 0 and 20 after vaccination. Bars represent mean ± SEM (B-E) Bacterial loads in blood and organ homogenates 72 hours after infection, depicted as scatter dot plots with a line at the median. Groups were compared using a Kruskal Wallis test followed by Dunns multiple comparisons test; #p < 0.05, ##p < 0.01, ###p < 0.001 versus empty pVAX; # p<0.05 vs. pVAX-hTPA-FliC tattoo. N = 7 or 8 mice per group. s.c., subcutaneous; i.n., intranasal; tt, tattoo
Figure 4. Decreased pulmonary cytokine levels and lung pathologic scores after single intranasal vaccination with pVAX-hTPA-FliC. All mice were given a single vaccination on day 0 (tattoo, subcutaneously or intranasally) and inoculated intranasally with 300 CFU B. pseudomallei on day 21. Lungs were harvested 72 hours after intranasal challenge with B. pseudomallei. TNFα (A), IL-6 (B) and CXCL1 (C) in lung homogenate; values are in pg/mL. Paraffin-embedded lung tissue sections were stained for Ly6G, a marker for neutrophil infiltration, and the percentage of the total lung surface positive for Ly6G was calculated digitally (D). As a representation for neutrophil degranulation, myeloperoxidase (MPO) was measured in lung homogenates (E). Lung tissue sections were stained with haematoxylin/eosin and scored on different parameters for pathology by a blinded pathologist (F). Representative images (with the median score) of the empty pVAX tattoo (G), rFliC + CFA (H), pVAX-hTPA-FliC tattoo (I) and pVAX-hTPA-FliC i.n. (J) groups (4x magnification). Data are presented as box- and whisker plots showing the smallest observation, lower quartile, median, upper quartile and largest observation. Groups were compared using a Kruskal Wallis test followed by Dunns multiple comparisons test; #p < 0.05, ##p < 0.01, ###p < 0.001 vs. empty pVAX; # p <0.05 vs. pVAX-hTPA-FliC tattoo. N = 7 or 8 mice per group. s.c., subcutaneous; i.n., intranasal; tt, tattoo
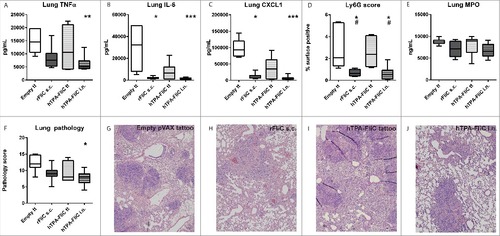
Figure 5. Diminished plasma cytokine levels and distant organ injury after single intranasal vaccination with pVAX-hTPA-FliC. All mice were given a single vaccination on day 0 (tattoo, subcutaneously or intranasally) and inoculated intranasally with 300 CFU B. pseudomallei on day 21. Plasma TNFα (A), IL-6 (B), IFNγ (C) and MCP-1 (D); values are in pg/mL. Liver tissue sections were stained with haematoxylin/eosin and scored on different parameters by a blinded pathologist, combined in a pathology score (E). ALT (F), AST (G) and LDH (H) were measured in plasma as markers for liver- and general cellular damage. Data are presented as box- and whisker plots showing the smallest observation, lower quartile, median, upper quartile and largest observation. N = 6–8 samples per group. Groups were compared using a Kruskal Wallis test followed by Dunns multiple comparisons test; #p < 0.05, ##p < 0.01, ###p < 0.001 vs. empty pVAX; # p < 0.05 vs. rFliC + CFA s.c. s.c., subcutaneous; i.n., intranasal; tt, tattoo
Figure 6. Increased survival after single intranasal vaccination with pVAX-hTPA-FliC. Survival (A) and clinical observation score (B) of control (open dots, n = 20) and intranasally vaccinated mice (gray dots, n = 15). All mice in the vaccinated group were given a single intranasal vaccination on day 0 and inoculated intranasally with 500 CFU B. pseudomallei on day 21. Controls did not receive any vaccine. Survival was monitored for 14 days. Data are presented as Kaplan-Meier survival curves. #p < 0.05, ##p < 0.01