Figures & data
Figure 1. Differential scanning fluorimetry and circular dichroism thermal gradient. (A) the melting curves, for DT (black) and DTd (orange), represented by fraction unfolded protein vs the temperature. (B) the melting curve for the TeNT (black), and the TTd at various stages in the detoxification process W0 (brown), W1 (gray), W2 (green), W3 (yellow) and W4 (orange). The dashed lines indicate the extrapolated melting temperature, Tm. (C) CD analysis melting spectra for the DT (black) and DTd (orange). (D) CD analysis melting spectra for TeNT (black) and TTd at various stages in the detoxification process (colored as in panel (B)). (E) comparison of Tms determined for DT and DTd by DSF and CD analysis (dotted and striped columns, respectively) and TeNT and TTd at different detoxification stages (solid and striped columns, respectively). The standard deviations (std) of the DSF determined Tm for each melting curve in (B) and column diagrams in (C) are ± 0.12 for TeNT, ± 0.37 (W0), ± 0.47 (W1), ± 0.37 (W2), ± 0.37 (W3) and ± 0.25°C (W4)
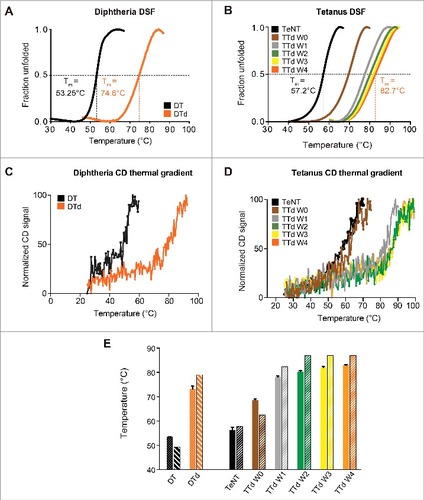
Figure 2. SAXS data on DT and DTd. (A) a plot of the scattering data for DT and DTd are shown in black and orange, respectively. They are shown as relative log (intensity) vs. inverse scattering angle. Inset shows the Guinier plot as log (intensity) vs. inverse scattering angle squared (s2). (B) the distance distribution function P(r). (C) overview of SAXS structural parameters. Rg is radius of gyration, Dmax is the longest dimension of the particle, V (Porod) is the excluded protein volume and MW is the estimated mass based on the Porod volume. (D) CRYSOL fit of the theoretical/calculated scattering of either the DT monomeric crystal structure (PDB code 1MDT) shown as red curve, or the dimer containing swapped catalytic domains (PDB code 1DDT) shown as blue curve. The fits were made against the experimental SAXS data of either the DT or the DTd, with only the former shown for clarity and depicted in black. The chi-values of the fits are shown in the inset table below the plot. (E) ab initio low resolution SAXS envelope of the DT toxin is shown as transparent gray envelope. The DT structure of the monomer was manually docked into the envelope, and rotated horizontally (below) and vertically (right). (F) ab initio low resolution SAXS envelope of the DTd
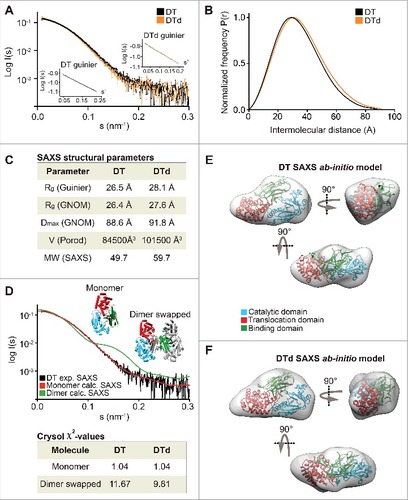
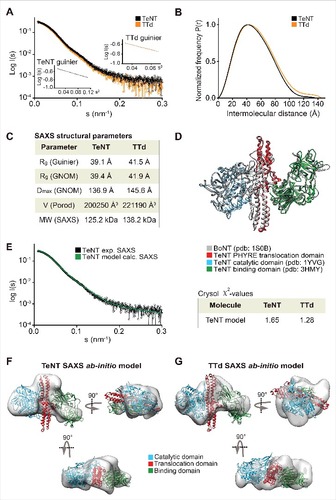
Figure 3. SAXS on TeNT and TTd. (A) plot of the scattering data for the TeNT (black) and TTd (orange), shown as relative log (intensity) vs. inverse scattering angle. Inset shows the Guinier plot as log (intensity) vs. inverse scattering angle squared (s2). (B) the distance distribution function P(r). (C) overview of SAXS structural parameters. Rg is radius of gyration, Dmax is the longest dimension of the particle, V (Porod) is the excluded protein volume and MW is the estimated mass based on the Porod volume. (D) TeNT structural homology model, generated using PHYRE2 based on the crystal structure of BoNT B (PDB code 1S0B).Citation36 BoNT, shown in gray, is aligned against the crystal structures of the TeNT catalytic domain (PDB code 1YVG)Citation9 shown in blue and the TeNT binding domain (PDB code 3HMY)Citation11 shown in green as well as the TeNT homology model shown in red. Only the translocation domain of TeNT is shown for clarity. (E) CRYSOL fit of the theoretical/calculated scattering of the PHYRE2 generated TeNT homology model shown as green curve against the experimental SAXS data of either TeNT or TTd, with only the former shown for clarity and depicted in black. The chi-values of the fits are shown in the inset table at the right of the plot. (F), ab initio low-resolution solution SAXS envelope (gray) of TeNT. The TeNT homology structural model was manually docked in the envelope, and rotated horizontally (below) and vertically (right). (G) ab initio low-resolution solution SAXS envelope (gray) of TTd