Figures & data
Table 1. List of primers used for nested overlap extension PCR and real-time qPCR analysis.
Table 2. A. baumannii genomes used in comparative whole genome analysis and MLST analysis.
Table 3. Important genome segment with genomic coordinates 2875478 – 2905039 present only in 21 genomes including A. baumannii PKAB07 but absent in many other genomes.
Figure 1. Circos plot showing SNP-distribution in the genome of A. baumannii PKAB07 and its correlation with accessory genome and the GC-skew (From inside out) Track-1 (green) - regions that are absent in at least one of the genomes (the accessory genome). Track-2 (red) – The chromosome of A. baumannii PKAB07. Track-3 (purple/orange) – Histogram showing GC-skew. Track-4 (red) – Scatter plot of SNP count/kb. Note the scattering of the plot outward at genomic regions where either a steep deviation from the GC-skew occurs or a syntenic link appears, or both (particularly, regions around 0.1 –0.3 Mb, 0.7–1 Mb, 1.2 Mb, 2–2.3 Mb; the outer numbers showing genomic coordinates in mb)
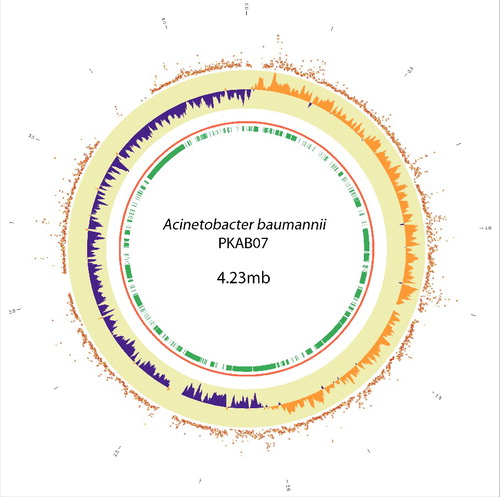
Figure 2. Unrooted phylogenetic tree representing the relatedness among the genomes under study. The tree file was generated by ProgressiveMauve and was visualized in FigTree (Version 1.4.1) (http://tree.bio.ed.ac.uk/software/figtree/). The PKAB07, despite closest to the clonal AC29, stands out in the tree, where as the rest of the strains clustered into 3 clades, a tree similar to that of Tan et al., (2013).
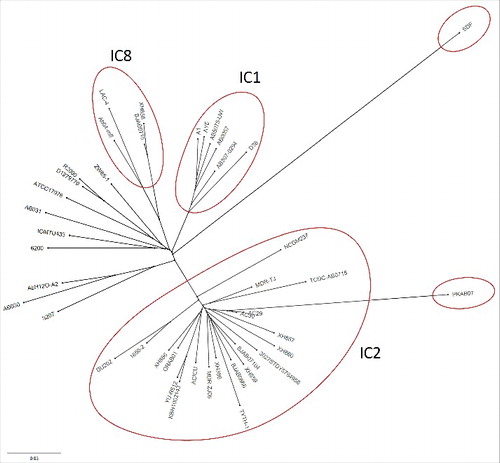
Figure 3. Heat map based on the distance matrix generated by ProgressiveMauve.Citation26 The pair-wise distance matrix was used to generate the heatmap using R program (http://www.r-project.org/). The legend shows the gradient color-code to the values in the distance matrix.
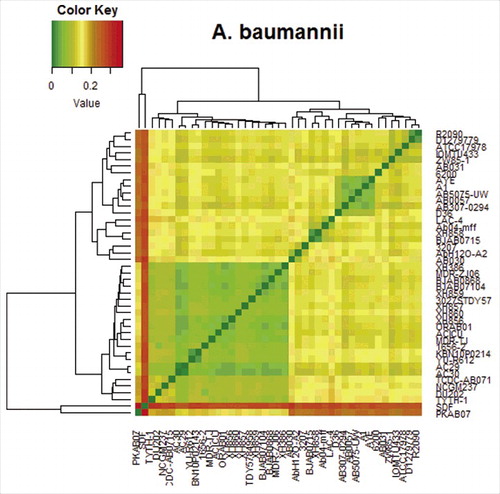
Figure 4. Location of ISAba1 loci in the genome of A. baumannii PKAB07 illustrated using CGview. Manual input through numerals for displaying the positions of ISAba1 throughout the genome was fed in CG view tool and the image was generated.
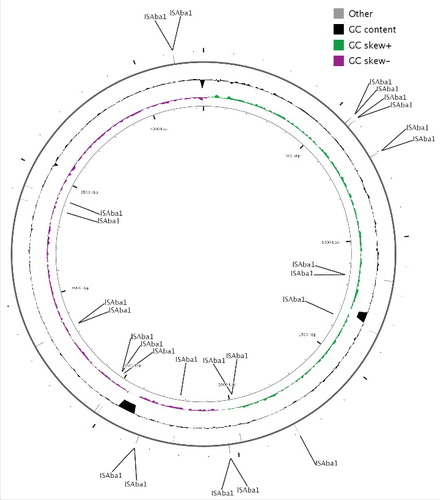
Figure 5. Quantitative Real-time PCR experiments for determining the expression levels of genes that are affected by ISAba1. Expression levels of adeN, adeJ, PAT and TonB receptor plug domain genes in A. baumannii strains ATCC 17978, ATCC ΔadeN, adeN complement and PKAB07. mRNA levels were determined by quantitative real-time PCR and normalized to the expression of rpoB in each sample. All data are representatives of at least 3 independent experiments. Statistical significance was derived using 2-tailed paired Student's t-test *, P < 0.05; **, P < 0.01; ***, P< 0.00 1. Error bars represent the standard error (SE) of the mean.
Figure 6. RND-type efflux pump genes among the sequenced genomes. 22 clusters of orthologous genes belonging to RND-type efflux pumps and efflux pumps that cause antibiotic resistance were mapped against 43 genomes that were analyzed, showing the presence (yellow) or absence (white) of the orthologous genes. Brown colored squares indicate the presence of 2 paralogs in the same genome. Strains that belong to IC1, IC2 and IC8 are shaded gray, yellow and green, respectively.
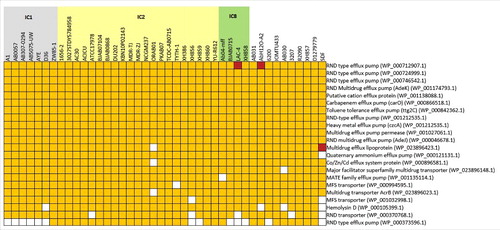
Table 4. Determination of MIC for 7 antibiotics in 4 strains included in the study.
Figure 7. Biofilm levels in adeN mutant and wild type strains - Microtitre plate biofilm assay was performed for A. baumannii strains ATCC 17978, ATCC ΔadeN, adeN complement and PKAB07 and the results were analyzed. Statistical significance was derived using 2-tailed Student's t-test (**, p < 0.005; ***, p < 0.001). Experiments were performed in triplicates and error bars represent the standard deviations.
Figure 8. (A) Co-culturing followed by AO/EB stainingA549 cells co-cultured with A. baumannii strains were added with AO/EB viability check stain and observed under fluorescent microscope B-2A filter (Nikon Eclipse TS100, Japan). PKAB07 and ΔadeN strains were found to be hyper invasive and induced more cell death as evidenced by the cellular uptake of ethidium bromide by A549 cells (B & C) when compared with the uninfected control (A). The virulence was compromised when the ΔadeN strain was complemented with pWH1266::adeN plasmid (D). Scale bar represents 50µm at 40X magnification.
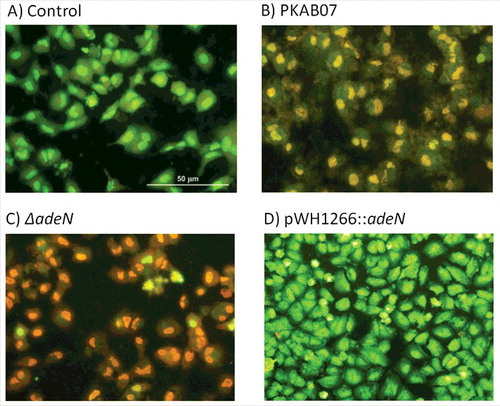
Figure 9. Annexin (V)expression analysis through flow-cytometer. Expression of Annexin V was evaluated using Annexin V-FITC Apoptosis Detection Kit (Sigma Aldrich, USA). A549 cells infected with A. baumannii strains ATCC 17978, ATCC ΔadeN, adeN complement and PKAB07 were analyzed after incubation for 24 h at 37°C, and statistical significance was derived using 2-tailed Student's t test (*x, P < 0.05; ***, P < 0.001). Experiments were performed in triplicates and error bars represent the standard deviations.
Figure 10. Survival Plot of Galleria mellonella larvae infected with the adeN knockout, wild type and complemented strains. PKAB07 and ΔadeN strains were found to be hyper- virulent and killed relatively higher number of larvae when compared with controls, ATCC 17978 and PBS. The virulence was compromised when G. mellonella infected with the complemented strain of ΔadeN with pWH1266::adeN plasmid.