
Figures & data
Table 1. Antibiotic resistance rates of A. baumannii isolates according to the presence of the hcp gene.
Table 2. Genotypes and distribution of A. baumannii isolates.
Figure 1. Diagram of the distribution of the hcp gene according to sequence type (ST). The numbers in the circles are the STs. The size of each circle represents the proportion of each ST, which are the marks within the circles. Solid line linkages indicate a single-locus variant, and dotted-line linkages indicate differences in 2 or 3 alleles.
Figure 2. Relative hcp transcript levels in A. baumannii isolates as measured by qRT PCR. hcp transcription levels are shown relative to that in A. baumannii ATCC 19606. The dashed line indicates 0.01-fold the expression levels of hcp in the reference strain, ATCC19606. The asterisk (*) and pound (#) symbols indicate the isolates with high and low hcp expression, respectively, that were used in the western blotting, competition, biofilm formation, and serum resistance assays.
Figure 3. Detection of Hcp, with RNA polymerase (RNAP) as a lysis control. (A) Three isolates showing high hcp transcript levels; (B) 2 isolates showing low hcp transcript levels, (i.e., less than 0.01-fold that of ATCC 19606). Immunoblots show Hcp in whole cells and concentrated culture supernatants prepared from cultures of clinical isolates.
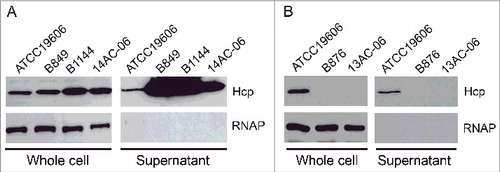
Table 3. Profiles of A. baumannii isolates used in western blotting and analyses of microbiologic characteristics.
Figure 4. Results of competition, biofilm formation, and serum resistance assays. These results came from 3 T6SS+ and 2 T6SS- isolates. (A) Relative in vitro competition indexes (CIs) for A. baumannii isolates by the presence of T6SS (T6SS+ vs. T6SS–). The CI values shown are the number of A. baumannii divided by the number of E. coli MG1655. Each circle represents the CI of each in vitro replicate. (B) Relative quantity of biofilm in A. baumannii isolates compared with that of ATCC 19606. (C) Serum resistance in A. baumannii isolates of each T6SS+ and T6SS– replicate. Serum resistance as a viability ratio (colony forming units [CFUs] of serum-bacterial suspension/ CFUs of bacterial suspension without normal human serum). The error bars indicate the standard deviations. *, Statically significant difference (P < 0.05).
![Figure 4. Results of competition, biofilm formation, and serum resistance assays. These results came from 3 T6SS+ and 2 T6SS- isolates. (A) Relative in vitro competition indexes (CIs) for A. baumannii isolates by the presence of T6SS (T6SS+ vs. T6SS–). The CI values shown are the number of A. baumannii divided by the number of E. coli MG1655. Each circle represents the CI of each in vitro replicate. (B) Relative quantity of biofilm in A. baumannii isolates compared with that of ATCC 19606. (C) Serum resistance in A. baumannii isolates of each T6SS+ and T6SS– replicate. Serum resistance as a viability ratio (colony forming units [CFUs] of serum-bacterial suspension/ CFUs of bacterial suspension without normal human serum). The error bars indicate the standard deviations. *, Statically significant difference (P < 0.05).](/cms/asset/003de40e-46ed-4767-8b22-4eff0d0ffc32/kvir_a_1323164_f0004_b.gif)
Table 4. Clinical characteristics of patients with T6SS+ A. baumannii bacteremia.Footnotea