
Figures & data
Figure 1. Tep1, Tep2 and Tep6 genes are upregulated in D. melanogaster flies by Photorhabdus infection. Transcript levels of Tep1, Tep2, Tep3 and Tep6 genes are shown in w1118 flies (n = 3–5) after (A) 6 and (B) 18 hpi with 1XPBS (septic injury control), E. coli (Ec), P. luminescens (Pl) and P. asymbiotica (Pa). Gene transcript levels are shown as relative abundance of transcripts normalized to RpL32 and expressed as a ratio compared with untreated flies (negative control). Significant differences are shown with asterisks (#p < 0.05, ##p < 0.01, ###p < 0.001). Bars show the means from 3 independent experiments and error bars represent standard deviation
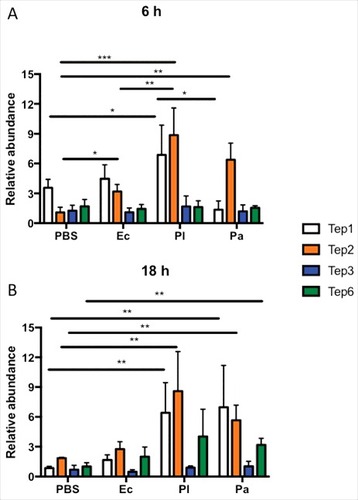
Figure 2. Survival and bacterial load analysis for tep2 and tep6 mutants after Photorhabdus infection. Survival curves for loss-of-function (A) tep2 mutants and (B) tep6 mutants with w1118 (background control flies) are shown. Flies (n = 20) were injected in the thorax by microinjection with 1XPBS (septic injury control), P. luminescens (Pl) or P. asymbiotica (Pa). Survival was monitored at 6 h intervals for 48 h. The black dotted line represents 50% survival. Colony forming units (CFU) of (C) P. luminescens and (D) P. asymbiotica are shown in tep2, tep6 and control flies (n = 5 per experimental condition) after 6 and 18 hpi. CFU were quantified through quantitative PCR of makes caterpillars floppy (mcf-1) in P. luminescens and the insecticidal toxin complex protein gene (tccC3) in P. asymbiotica. Significant differences are indicated with asterisks (# p < 0.05, ## p <0.01, ### p <0.001). The means from 3 independent experiments are shown and error bars represent standard errors (survival) and standard deviation (bacterial load)
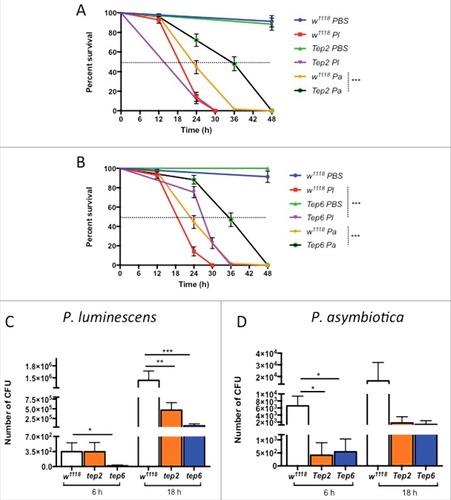
Figure 3. D. melanogaster Tep2 and Tep6 differentially regulate the activation of immune pathways against Photorhabdus. Transcript levels for (A, B) Defensin (Toll pathway), (C, D) Diptericin (IMD pathway), (E, F) Tot-M (JAK/STAT pathway) and (G, H) Puckered (JNK pathway) in loss-of function tep2 and tep6 mutants with their corresponding control strain (w1118) at 6 and 18 hpi with 1XPBS, E. coli (Ec), P. luminescens (Pl) or P. asymbiotica (Pa) (n = 3 individuals per experimental condition). Gene transcript levels are shown as relative abundance of transcripts normalized to RpL32 and expressed as a ratio compared with untreated flies (negative control). Values represent the means from 3 biologic replicates and error bars represent standard deviations. Significant differences are indicated with asterisks; #p <0.05, ##p <0.01, ###p <0.001, ####p <0.0001)
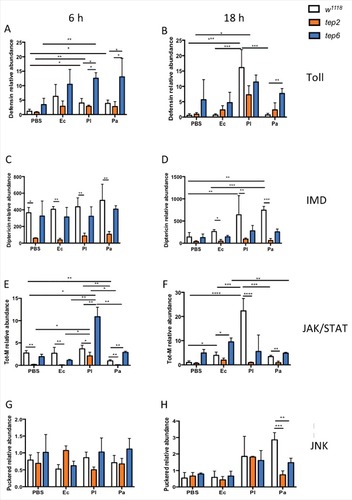
Figure 4. Transcript levels of Tep2 and Tep6 are significantly decreased in control flies (w1118) with functionally ablated hemocytes. Transcript levels of (A) Tep2 and (B) Tep6 at 6 and 18 hpi with 1XPBS, E. coli (Ec), P. luminescens (Pl) or P. asymbiotica (Pa) in w1118 flies (n = 5) pre-injected with beads or 1XPBS. Significant differences are indicated with asterisks (#p < 0.05, ## p < 0.01, ###p < 0.001). Bars show the means from 2 independent experiments and error bars represent standard deviations
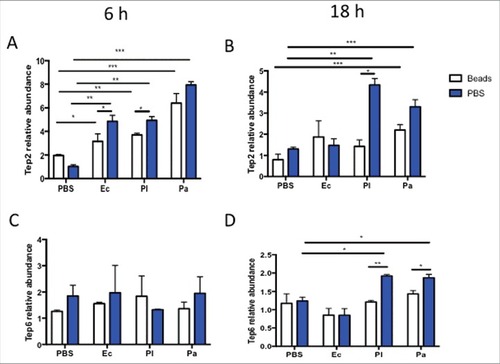
Figure 5. D. melanogaster tep2 and tep6 mutants display variable number of total hemocyte counts and increased hemocyte viability compared with control flies (w1118) after Photorhabdus infection. According to the hemocyte counting protocol, total number of hemocytes (total cells/ml) in tep2 and tep6 mutants with control flies after 18 h of injection with 1XPBS, (A) P. luminescens (Pl) or (B) P. asymbiotica (Pa). The percentage of total viable cells in the control and tep mutant flies at 18 hpi with 1XPBS, (C) P. luminescens and (D) P. asymbiotica. Significant differences are indicated with asterisks (#p < 0.05, ##p < 0.01, ###p < 0.001). Bars show the means from 3 independent experiments and error bars represent standard deviations
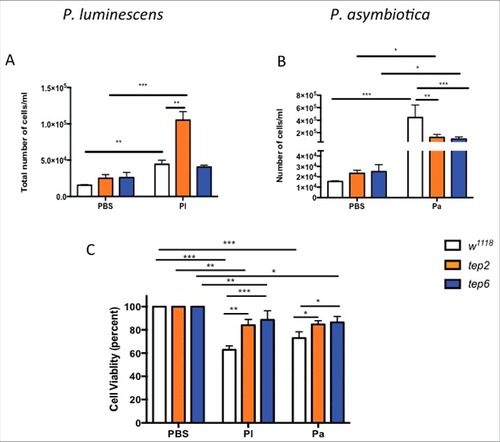
Figure 6. Tep2 and Tep6 are essential for the phagocytosis process in Drosophila. (A) Representative images of phagocytosis in tep2 and tep6 loss-of-function mutants and control flies (w1118) at 1 hpi of lipophilized pHrodo-labeled E. coli particles. Images were taken using fluorescence microscopy at 10X magnification. (B) Corrected total cell fluorescence (CTCF) in tep mutants and w1118 flies (n = 7), 1 h following injection of pHrodo-labeled E. coli. Images were processed in ImageJ and CTCF was estimated. Transcript levels of Eater in tep mutants and w1118 flies (n = 5) at (C) 6 h and (D) 18 hpi of 1XPBS, E. coli (Ec), P. luminescens (Pl) or P. asymbiotica (Pa). Significant differences are indicated with asterisks (#p < 0.05, ##p < 0.01, ###p < 0.001). The means from 2 (Eater transcription) -three (Phagocytosis) independent experiments are shown and error bars represent standard deviation
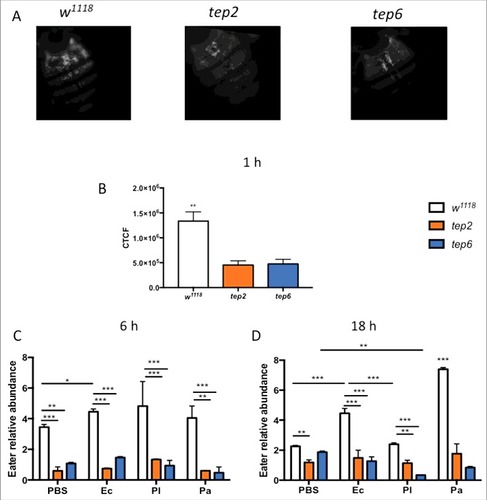
Figure 7. Melanization response and PO activity are elevated in D. melanogaster tep2 mutants upon Photorhabdus infection. (A) Melanization of the wound site in tep2 and tep6 loss-of-function mutant flies and their background control strains (w1118) is shown at 10X magnification 3 h after injection with PBS, P. luminescens or P. asymbiotica bacteria. Arrows indicate the site of injury. (B) PO activity in the hemolymph plasma of tep2, tep6 mutants and control flies (w1118) at 3 hpi with PBS, P. luminescens (Pl) or P. asymbiotica (Pa) (n = 20 flies) as measured by the optical density at 492 nm after incubation with L-Dopa. Values represent the means from 3 biologic replicates and error bars represent standard deviations. Significant differences are indicated with asterisks (#p < 0.05, ##p < 0.01, ###p < 0.001, ####p < 0.0001). The means from 3 independent experiments are shown and error bars represent standard deviation
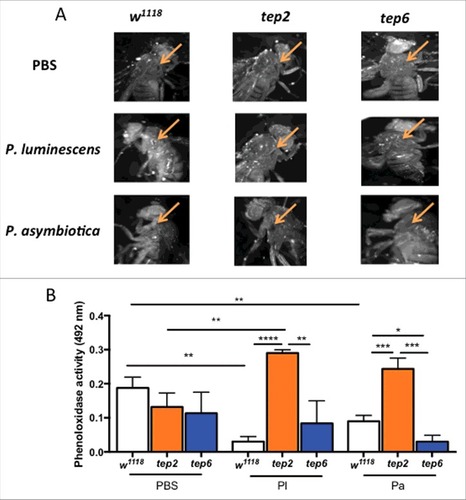
Table 1. List of primers used in the study