Figures & data
Figure 1. MUC1 controls pneumococcal levels in the lungs and blood of S. pneumoniae infected mice. Wildtype (WT) and Muc1−/− mice were infected intranasally with S. pneumoniae D39 strain. Pneumococcal levels were determined 16 hours (A, B, C and D) and 1 hour (E) after infection by colony-forming assay. (A) No significance difference in S. pneumoniae loads in the nasopharynx of WT and Muc1−/− mice. (B) Muc1−/− display significantly higher levels of S. pneumoniae in the lungs as compared with WT mice; data pooled from 2 independent experiments (###p < 0.001, 2-tailed Student's t-test) (C) S. pneumoniae detected in the broncho-alveolar lavage fluid (BALF) from infected WT and Muc1−/− mice. (D) A significantly higher number of S. pneumoniae-infected Muc1−/− mice developed bacteremia as compared with infected WT mice; data pooled from 3 independent experiments (#p < 0.05, Fisher's exact test). (E) After 1 hour of infection, similar levels of pneumococci were recovered from the lungs of WT and Muc1−/− mice. Graphs present individual mice (points) and group medians (horizontal bar). The limit of detection (LD, 100 CFU/ml) is shown as a dotted line. BALF- broncho-alveolar lavage fluid
Figure 2. Knockdown of MUC1 expression is associated with reduced pneumococcal adherence to A549 cells. (A) MUC1 Expression in wildtype (WT) and mutated clone (MUC1 clone) of A549 cells was quantified using qPCR. There was nearly 75% knockdown of MUC1 expression in MUC1 clone as compared with WT. (B) WT and MUC1 clone of A549 cells (n = 5) were co-cultured with S. pneumoniae D39 strain at a multiplicity of infection of 50: 1 and adherence assessed following 1, 2 and 6 hours of incubation. MUC1 knockdown in A549 cells lead to significantly lower binding of pneumococci (#p < 0.05, ##p < 0.01, Student's t-test)
Figure 3. MUC1 prevents lung inflammation in S. pneumoniae infected mice. Representative H&E stained lung photomicrographs in (A) uninfected WT (B) uninfected Muc1−/− (C) infected WT (D) infected Muc1−/− mice. (E) Blinded H&E stained lung sections were graded for cellular infiltration. Infected Muc1−/− displayed significantly higher cellular infiltrate in the lungs as compared with uninfected Muc1−/− mice. (#p < 0.05, Mann-Whitney). Graph presents individual mice (points) and group medians (horizontal bar). Arrows indicate cellular infiltrate. Uninf, uninfected; Inf, infected. Scale bar = 100 µm
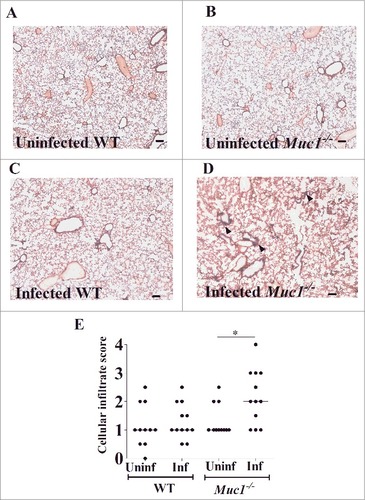
Figure 4. Pro-inflammatory cytokine profile of the nasopharynx. Cytokine levels from nasopharyngeal homogenates of Wildtype (WT) and Muc1−/ mice (n = 7–8) infected with S. pneumoniae D39 strains for 16 hours were measured by ELISA. Graphs present the median (horizontal bar), interquartile range (box) and 10th and 90th percentiles (error bars). Uninf, uninfected; Inf, infected. Data analyzed using Student's t-test
Figure 5. MUC1 deficiency is associated with elevated inflammatory cytokines responses in the lungs during S. pneumoniae infections. Cytokine levels from lung homogenates of wildtype (WT) and Muc1−/− mice (n = 13–14) infected with S. pneumoniae D39 strains for 16 hours were measured by ELISA. Infected Muc1−/− mice produced significantly higher amounts of all pro-inflammatory cytokines assayed, as compared with uninfected Muc1−/− mice (#p < 0.05, ##p < 0.01,Student's t-test). Graphs present the median (horizontal bar), interquartile range (box) and 10th and 90th percentiles (bars). Uninf, uninfected; Inf, infected
Figure 6. Immunophenotyping of cells infiltrating the lungs shows increased levels of monocytes and macrophages in S. pneumoniae infected mice. Flow cytometry was used to characterize the immune cells recruited to the lungs of S. pneumoniae infected mice and uninfected wildtype (WT) and Muc1−/− mice (n = 5–6). There were significantly more alveolar macrophages, interstitial macrophages and Ly6c- monocytes in the lungs of infected Muc1−/− mice as compared with uninfected Muc1−/− mice. For WT mice, there were significantly more alveolar macrophages in infected mice compared with uninfected mice (#p < 0.05, ##p < 0.01, Student's t-test).Graphs present the median (horizontal bar), interquartile range (box) and 10th and 90th percentiles (bars). DC-dendritic cells; Uninf, uninfected; Inf, infected
Figure 7. MUC1 facilitates the phagocytosis and killing of S. pneumoniae. Macrophages from wildtype (WT) and Muc1−/− mice (n = 5) were co-cultured in vitro with CFSE-labeled S. pneumoniae strain D39, TIGR4A, PMP1 and PMP1287 and P. aeruginosa strain NCTC10662 (multiplicity of infection 50:1) for time-points shown. (A) Muc1−/− macrophages have significantly decreased intracellular S. pneumoniae D39, TIGR4A and PMP1278 strains as compared with WT cells (#p < 0.05, ##p < 0.01, Student's t-test). (B) Significantly reduced killing of S. pneumoniae D39 strain by Muc1−/− macrophages compared with WT macrophages was observed after 120 min of co-culture (##p < 0.01, Student's t-test). (C) While intracellular S. pneumoniae was significantly higher in WT macrophages as compared with Muc1−/− macrophages, Muc1−/− macrophages had significantly increased phagocytosis of P. aeruginosa 60 mins after co-culture (##p < 0.01, ###p < 0.001, Student's t-test). Data shown are representative of 4 experiments for S. pneumoniae D39 and 1 for other bacterial strains. Graphs present the median (horizontal bar), interquartile range (box) and 10th and 90th percentiles (bars)