Figures & data
Figure 1. Struction of Osthol (Ost).
Figure 2. Agar disk diffusion assay of FLC combined with Ost against C.albicans 103. Panels A and C show plain agar plates, and panel B shows an agar plate containing 64 μg/ml of FLC. Panel D describes the images for panels A and B, and panel E describes the image for panel C.
Table 1. Interaction of FLC and Ost against 11 clinical isolates of C. albicans resistant to FLC by MIC80s of checkerboard microdilution assay.
Figure 3. The characteristics of Ost-S100-NP. (A) Particle size distributions of Ost-S100-NP. (B) X-ray diffraction of (a) Ost (b) S100 (c) Poloxamer 188 (d) physical mixture of Ost、Eudragit S100 and Poloxamer 188 (e) Ost-S100-NP. (C) DSC spectra of (a) Ost (b) S100 (c) P188 (d) physical mixture of Ost、S100 and P188 (e) Ost-S100-NP. (D) Appearance of Ost-S100-NP under electric microscope (× 50,000).
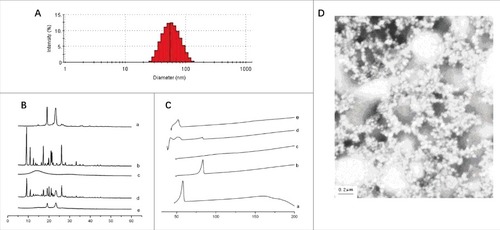
Figure 4. Blood concentration of profile of Ost after oral Administration of Ost-suspension(■) and Ost-S100-NP(▴) to fasted rats at a dose of 25 mg/kg (n = 8).
Table 2. The Main Pharameters after Oral Administration of Ost-suspension and Ost-S100-NPs in rats. Mean ± SE (n = 8).
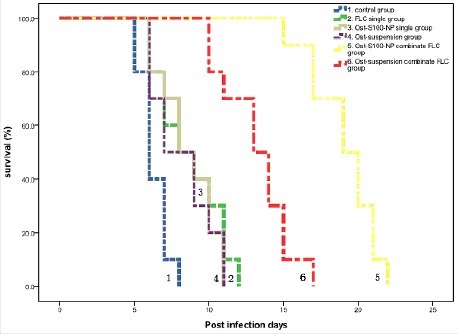
Figure 5. Kaplan-Meier survival curves of C. albicans 103 infecting mice treated with physiologic saline (Equation1(1)
(1) ), FLC single (Equation2
(2)
(2) ), Ost-S100-NP single (Equation3
(3)
(3) ), Ost-suspensions single (4), Ost-S100-NP combinate FLC (5), and Ost-suspensions combinate FLC (6) respectively.