Figures & data
Table 1. Major features of plasmids analyzed.
Table 2. Drug resistance genes in sequenced plasmids.
Table 3. Antimicrobial drug susceptibility profiles.
Figure 1. The MDR-1 region from p505108-MDR and comparison with related regions. Genes are denoted by arrows. Genes, mobile elements and other features are colored based on function classification. Shading denotes regions of homology (> 95% nucleotide identity). Numbers in brackets indicate the nucleotide positions within the corresponding plasmids.
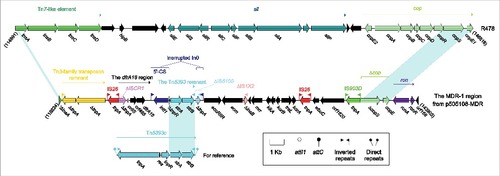
Figure 2. The MDR-2 region from p505108-MDR and comparison with related regions. Genes are denoted by arrows. Genes, mobile elements and other features are colored based on function classification. Shading denotes regions of homology (> 95% nucleotide identity). Numbers in brackets indicate the nucleotide positions within the corresponding plasmids.
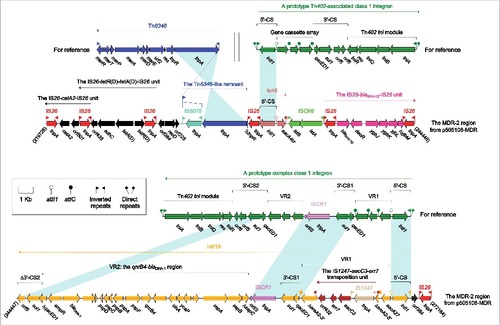
Figure 3. Tn6362 from p505108-MDR and comparison with related regions. Genes are denoted by arrows. Genes, mobile elements and other features are colored based on function classification. Shading denotes regions of homology (> 95% nucleotide identity). Numbers in brackets indicate the nucleotide positions within the corresponding plasmids.
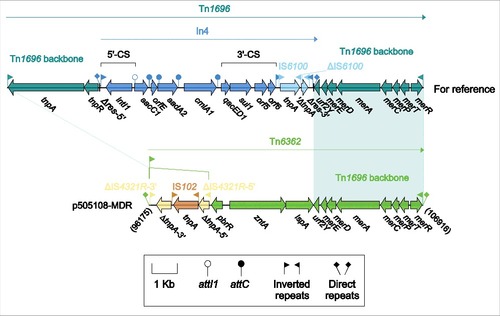
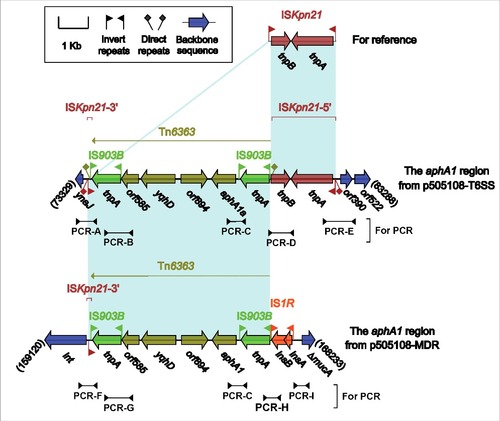
Figure 4. The aphA1a regions from p505108-MDR and p505108-T6SS and comparison with related regions. Genes are denoted by arrows. Genes, mobile elements and other features are colored based on function classification. Shading denotes regions of homology (> 95% nucleotide identity). Numbers in brackets indicate the nucleotide positions within the corresponding plasmids. The arrowheads indicated the location of PCR primers and the expected amplicons. See Figure S6 for the PCR results.