Figures & data
Figure 1. (A). Identified mutations of ORF1 and ORF2 regions of HEV. The number within the box represents the amino acid position; the letter(s) above the box refer to the wild type amino acid, and the letter below the box are relevant mutations reported in previous studies. (Met: methyltransferase; Y: Y-domain; HVR: hypervariable regions; Hel: RNA helicase; RdRP: RNA-dependent RNA polymerase; C: capsid protein) (B). The prevalence of mutations within HEV genotype 1 (n = 81), 3 (n = 182) and 4 (n = 143). Amino acid diversity was measured as the proportion of sequences that varies from the consensus sequence.
Table 1. All possible and experimentally confirmed (in vivo and in vitro) mutations and their prevalence in the major HEV genotypes (1, 3, 4). Different colors indicate the mutations related to ribavirin treatment failure (yellow), chronic hepatitis (purple), hepatic failure (red) or altered immunoreactivity (blue).
Table 2. Antigenicity evaluation of wild-type and mutated epitopes. The effect of mutations on the antigenicity (threshold level = 0.4) of T cell predicted epitopes (MHCI and MHCII). Bold letters (one-letter amino acid code) represent mutations within the predicted epitopes.
Table 3. Antigenicity evaluation of wild-type and mutated epitopes. The effect of mutations on the antigenicity (threshold level = 0.4) of predicted B cells epitopes. Bold letters (one-letter amino acid code) represent mutations within the predicted epitopes.
Figure 2. Antigenicity difference between wild-type and mutated T cell (MHCI and MHCII) (A) and B cell epitopes (B).
Figure 3. The effects of mutations (P259S, L477T) on the structural stability of ORF2 region of HEV predicted by DUET web server. Mutations are shown in blue color ribbon. (A) Crystal struture without mutation of ORF2 (2ZTN-amino acid 129–606). (B). P259S; feature: distabilizing; secondary structure: loop or irregular. (C). L477T; feature: distabilizing; secondary structure: extended β-strand.
Figure 4. A heat map showing the evolvment of mutations with years. Mutations 1 = F179S, 2 = A317T, 3 = T735I, 4 = L1110F, 5 = V1120I, 6 = V1213A, 7 = Y1320H, 8 = K1383N, 9 = D1384G, 10 = K1398N, 11 = F1439Y, 12 = V1479I, 13 = C1483W, 14 = N1530T, 15 = Y1587F, 16 = G1634R, 17 = G1634K, 18 = P259S, 19 = L477T, 20 = L613T. Each box represents the sequence of ORF 1 or ORF2, from genotype 1, 3 or 4 in a particular year. Red colored boxes represent the mutations related to hepatic failure mutations; purple to chronic hepatitis; yellow to ribavirin treatment failure; and blue to altered immunoreactivity. The year of deposition of each sequence is mentioned in the arrow below the heat map.
Figure 5. Evolution period of overlapped mutations. Each bar represents the evolving period (years) of each mutations.
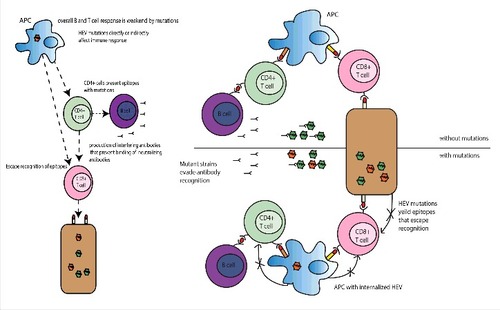
Figure 6. Possible mechanisms of immune evasion by hepatitis E virus. Main routes by which HEV mutations may result in evasion of the host immune responses. Mutated epitopes presented by antigen presenting cells, B and T cells will results in escape recognition of the epitopes.