Figures & data
Figure 1. G. mellonella larvae (n ≥ 19) were injected with 100 µg standard pure (ST LPS) (A), ultrapure LPS (UP LPS) (B) or synthetic TLR2 ligand Pam2CSK4 (C) dissolved in 10 µl of PBS. As negative control, larvae were injected with the same volume PBS. Survival was analyzed over 4 d. The figure clearly shows that ST LPS injected larvae but not the UP LPS or PBS injected larvae die upon injection. Shown data are mean values ± SD. ## = P ≤ 0.01, Log-rank (Mantel-Cox) Test
Figure 2. G. mellonella larvae (n ≥ 8) were injected with 1 µg ultrapure or standard LPS or Pam2CSK4 were dissolved in 10 µl of PBS. As negative control larvae were injected with the same volume PBS. Expression of gloverin (A), cecropin (B), galliomyin (C), gallerimycin (D) and impi (E) mRNA was analyzed using qRT PCR. Shown data are mean values ± SD. Not significant (ns) = P>0.05; # = P ≤ 0.05; ## = P ≤ 0.01; ### = P ≤ 0.001; #### = P ≤ 0.0001, One-way analysis of variance and Tukey's Multiple Comparison Test or if values are not Gauss distributed Kruskal-Wallis test and Dunn's Multiple Comparison Test
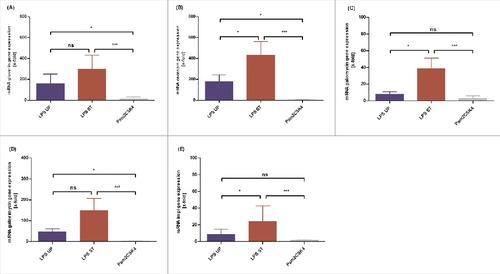
Figure 3. G. mellonella larvae (n ≥ 20) were injected with 100 µg Pam2CSK4 | UP LPS mixture in various ratios (Pam2CSK4 20% | LPS UP 80% (A), Pam2CSK4 40% | LPS UP 60% (B), Pam2CSK4 60% | LPS UP 40% (C), Pam2CSK4 80% | LPS UP 20% (D)) dissolved in 10 µl of PBS. As negative control larvae were injected with the same volume PBS. Survival was monitored over 5 d. The figure clearly demonstrates that all Pam2CSK4 | UP LPS mixtures injected larvae or PBS injected larvae survived
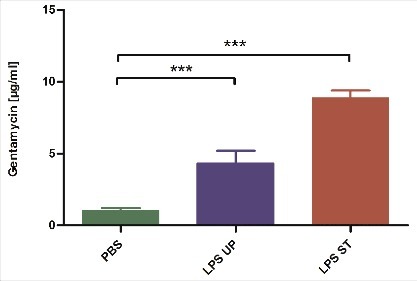
Figure 4. G. mellonella larvae (n ≥ 6) were treated with either 1 µg standard or ultrapure LPS dissolved in 10 µl of PBS. 18 h after injection 5 µl of hemolymph were transferred onto Geobacillus stearothermophilus spore plates. After 24 h the diameter of inhibition zones was measured and normalized to a gentamicin standard curve. Shown data are mean values ± SD. Not significant (ns) = P>0.05; # = P ≤ 0.05; ## = P ≤ 0.01; ### = P ≤ 0.001; #### = P ≤ 0.0001, One-way analysis of variance, Tukey's Multiple Comparison Test