1,550
Views
21
CrossRef citations to date
0
Altmetric
Research Paper

Naïve B cells reduce fungal dissemination in Cryptococcus neoformans infected Rag1−/− mice

, , &
Pages 173-184 | Received 06 May 2016, Accepted 18 Aug 2017, Published online: 04 Oct 2017

Figures & data

Figure 1. C. neoformans fungal burdens in lungs and brains of Rag1−/− and C57Bl/6 (wild type) mice. Fungal burdens, depicted as CFU on the Y axis, in the lungs (A) and brains (B) of Rag1−/− and wild-type mice on the days after infection indicated on the X axis. Each symbol represents one mouse; (A-B) show combined results from 3 separate experiments. Bars represent medians. #p < 0.05, Mann-Whitney test; ns – not significant
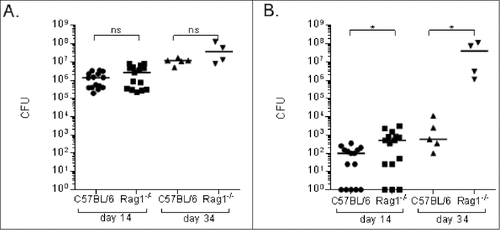
Figure 1. C. neoformans fungal burdens in lungs and brains of Rag1−/− and C57Bl/6 (wild type) mice. Fungal burdens, depicted as CFU on the Y axis, in the lungs (A) and brains (B) of Rag1−/− and wild-type mice on the days after infection indicated on the X axis. Each symbol represents one mouse; (A-B) show combined results from 3 separate experiments. Bars represent medians. #p < 0.05, Mann-Whitney test; ns – not significant

Figure 2. Effect of adoptive transfer of naïve splenic (B)cells to Rag1−/− mice on lung and brain CFU and lymphocyte profiles of C. neoformans-infected mice. Lung (A) and (B) brain CFU are depicted 21 d post-infection on the Y axis for wild-type, Rag1−/−, and Rag1−/− (Rag1−/− + B cells) mice that received 106 naïve splenic B cells i.v. one week before infection, depicted on the X axis. Lung lymphocyte numbers of B-1a and B-1b B (C) and B-2 B and T (D) cells determined by flow cytometry are depicted for wild-type and Rag1−/− + B cells mice 21 d post-C. neoformans infection (28 d after adoptive transfer). Each symbol represents one mouse; (A-B) present data from 3 separate experiments, (C-D) represent the results of one experiment. (C-D) Figure legend applies to both panels. Bars are medians. ##p < 0.01, ###p < 0.001, Kruskall-Wallis test, correcting for multiple comparisons; ns – not significant
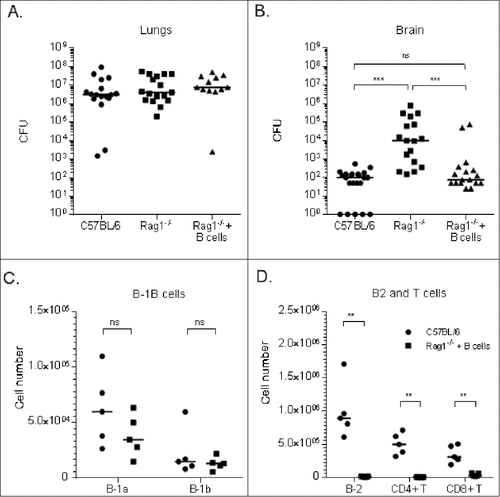
Figure 2. Effect of adoptive transfer of naïve splenic (B)cells to Rag1−/− mice on lung and brain CFU and lymphocyte profiles of C. neoformans-infected mice. Lung (A) and (B) brain CFU are depicted 21 d post-infection on the Y axis for wild-type, Rag1−/−, and Rag1−/− (Rag1−/− + B cells) mice that received 106 naïve splenic B cells i.v. one week before infection, depicted on the X axis. Lung lymphocyte numbers of B-1a and B-1b B (C) and B-2 B and T (D) cells determined by flow cytometry are depicted for wild-type and Rag1−/− + B cells mice 21 d post-C. neoformans infection (28 d after adoptive transfer). Each symbol represents one mouse; (A-B) present data from 3 separate experiments, (C-D) represent the results of one experiment. (C-D) Figure legend applies to both panels. Bars are medians. ##p < 0.01, ###p < 0.001, Kruskall-Wallis test, correcting for multiple comparisons; ns – not significant

Figure 3. Immunoglobulin (Ig) levels of Cryptococcus neoformans-infected C57Bl/6 (wild-type) and Rag1−/− mice. Serum IgM (A, C) and IgG (B, D) levels, depicted on the Y axis, are shown for the mouse groups and times indicated on the X axis. Serum GXM-binding IgM (α GXM IgM) (E) and lung levels of IgM (F) are shown for the groups indicated on the X axis. Each symbol represents one mouse; (C-F) present data from 2 separate experiments. Bars are medians. #p < 0.05, ##p < 0.01, ##,p < 0.001, ###,p < 0.001, Kruskal-Wallis test, correcting for multiple comparisons; ns – not significant
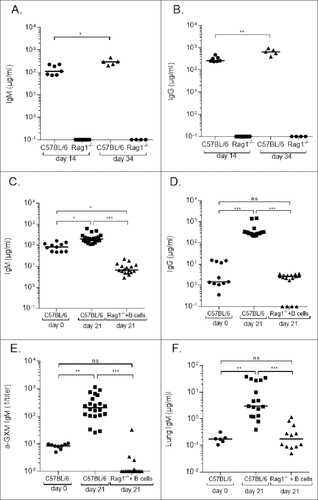
Figure 3. Immunoglobulin (Ig) levels of Cryptococcus neoformans-infected C57Bl/6 (wild-type) and Rag1−/− mice. Serum IgM (A, C) and IgG (B, D) levels, depicted on the Y axis, are shown for the mouse groups and times indicated on the X axis. Serum GXM-binding IgM (α GXM IgM) (E) and lung levels of IgM (F) are shown for the groups indicated on the X axis. Each symbol represents one mouse; (C-F) present data from 2 separate experiments. Bars are medians. #p < 0.05, ##p < 0.01, ##,p < 0.001, ###,p < 0.001, Kruskal-Wallis test, correcting for multiple comparisons; ns – not significant

Figure 4. Cytokine levels in the lungs of C57Bl/6 (wild-type) mice and Rag1−/− mice 14 d after C. neoformans infection. Interleukin (IL)-6 (A, C) interferon (IFN)-γ (B, D) concentrations are depicted on the Y axis for the mice indicated on the Y axis. The key in panel A refers to all panels in the figure. Open squares represent Rag1-/- mice in Panels (C)and D. Data in Panels C and D, 14 d post-infection. Data from 2 experiments (one in Panels A and B and one in Panels C and D) are shown. Each symbol represents one mouse. Concentrations were determined by ELISA. ##p < 0.01, ###p < 0.001, Student's t-test
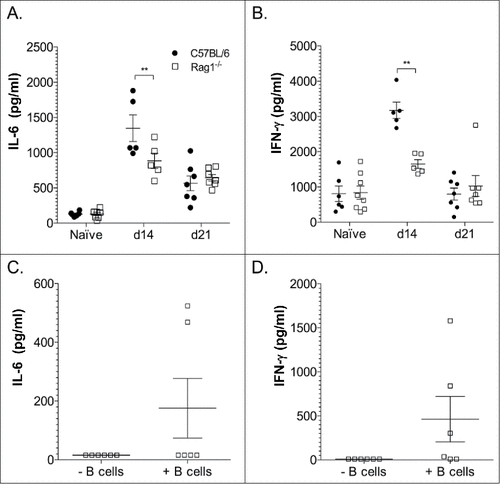
Figure 4. Cytokine levels in the lungs of C57Bl/6 (wild-type) mice and Rag1−/− mice 14 d after C. neoformans infection. Interleukin (IL)-6 (A, C) interferon (IFN)-γ (B, D) concentrations are depicted on the Y axis for the mice indicated on the Y axis. The key in panel A refers to all panels in the figure. Open squares represent Rag1-/- mice in Panels (C)and D. Data in Panels C and D, 14 d post-infection. Data from 2 experiments (one in Panels A and B and one in Panels C and D) are shown. Each symbol represents one mouse. Concentrations were determined by ELISA. ##p < 0.01, ###p < 0.001, Student's t-test

Figure 5. Effect of passive transfer of naïve sera on alveolar macrophage phagocytosis of Cryptococcus neoformans-infected Rag1−/− mice. Phagocytosis, measured by the percent of intracellular yeast cells compared with untreated cells, by alveolar macrophages, 24 hrs post-infection is shown on the Y axis for IgM-deficient and IgM-containing IgG-depleted C57Bl/6 serum. Data from 2 independent experiments are shown. ##p < 0.01, Student's t-test
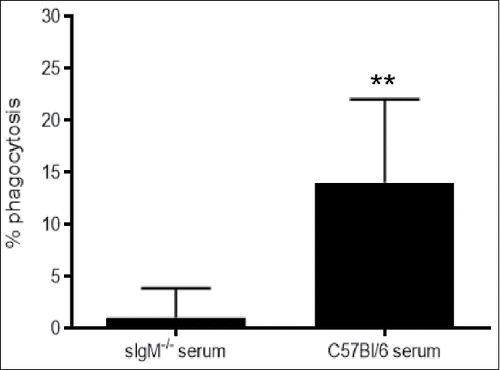
Figure 5. Effect of passive transfer of naïve sera on alveolar macrophage phagocytosis of Cryptococcus neoformans-infected Rag1−/− mice. Phagocytosis, measured by the percent of intracellular yeast cells compared with untreated cells, by alveolar macrophages, 24 hrs post-infection is shown on the Y axis for IgM-deficient and IgM-containing IgG-depleted C57Bl/6 serum. Data from 2 independent experiments are shown. ##p < 0.01, Student's t-test

Figure 6. Inflammatory patterns (H&E) of C. neoformans-infected C57Bl/6 (wild-type), Rag1−/− mice that received (B)cells and Rag1−/− mice, 14 d post-infection. A) Wild-type mice. Arrows point to large collections of extracelluar organisms in airspaces. Inset: Organized granulomatous inflammation composed of polymorphonuclear leukocytes, lymphocytes, epithelioid cells and macrophages. Inset: arrows point to lymphocytes and macrophages associated with perivascular inflammation. Five mice were examined. (B) Rag1−/− mice that received peritoneal B cells. Arrows point to organized granulomatous inflammation composed of lymphocytes, polymorphonuclear leukocytes and macrophages associated with perivascular inflammation. There are also large collections of organisms in airspaces. Inset: arrows pointing to lymphocytes and macrophages in cellular infiltrate.  Two mice were examined. (C) Rag1−/− mice. Arrows point to large collections of extracellular organisms in airspaces. Inset: Inflammatory cells are polymorphonuclear leukocytes, epitheloid cells and macrophages as shown by arrows. Five mice were examined. Scale bar = 50 um.
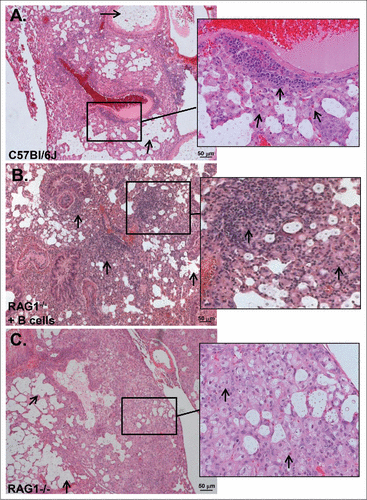
Figure 6. Inflammatory patterns (H&E) of C. neoformans-infected C57Bl/6 (wild-type), Rag1−/− mice that received (B)cells and Rag1−/− mice, 14 d post-infection. A) Wild-type mice. Arrows point to large collections of extracelluar organisms in airspaces. Inset: Organized granulomatous inflammation composed of polymorphonuclear leukocytes, lymphocytes, epithelioid cells and macrophages. Inset: arrows point to lymphocytes and macrophages associated with perivascular inflammation. Five mice were examined. (B) Rag1−/− mice that received peritoneal B cells. Arrows point to organized granulomatous inflammation composed of lymphocytes, polymorphonuclear leukocytes and macrophages associated with perivascular inflammation. There are also large collections of organisms in airspaces. Inset: arrows pointing to lymphocytes and macrophages in cellular infiltrate.  Two mice were examined. (C) Rag1−/− mice. Arrows point to large collections of extracellular organisms in airspaces. Inset: Inflammatory cells are polymorphonuclear leukocytes, epitheloid cells and macrophages as shown by arrows. Five mice were examined. Scale bar = 50 um.
Supplemental material

KVIR_S_1370529.zip

Download Zip (67.6 KB)