Figures & data
Figure 1. Arg1 from C. neoformans restores defective phenotypes in the S. cerevisiae arg82Δ mutant. ARG1 cDNA was cloned into the pESC-LEU vector, which was then used to transform the S. cerevisiae arg82Δ mutant. Cells containing cloned ARG1 or empty vector were spotted onto plates containing the various media, as indicated, from 106 cells per drop to 10 cells per drop. Plates were incubated at either 30°C or 39°C
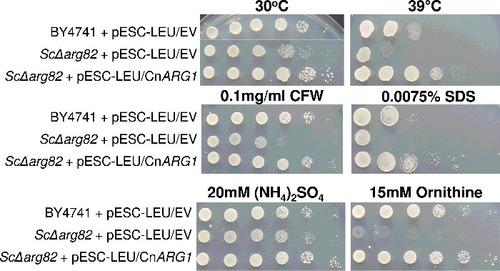
Figure 2. Arg1 and Arg82 differentially contribute to stress adaptation of C. neoformans and S. cerevisiae. WT and the indicated mutant strains were spotted onto plates containing the various media, as indicated, from 106 cells per drop to 10 cells per drop, and incubated for 2–4 days
Figure 3. Purified Arg1 specifically phosphorylates IP3 to produce IP4 and IP5. (A) Recombinant Arg1 (49 kDa, including the His6 tag) was purified by TALON cobalt affinity chromatography followed by ion exchange chromatography (IEC). (B) Purified Arg1 (1–10 ng/µl reaction, as indicated) was incubated with ATP and IP3 and the reaction products analyzed by polyacrylamide gel electrophoresis and Toluidine Blue staining. Bands representing different IP species and ATP are indicated. (C) Kinetics of Arg1 activity. For these assays, purified Arg1 (20 ng) was incubated with ATP (50–500 µM) and 200 µM of IP3 in 10 µL reactions at room temperature for 0–30 min. The consumption of ATP was monitored using bioluminescence. The assay was performed twice, each time in triplicate. V: reaction velocity
Figure 4. Comparative phenotypic testing of arg1Δ and kcs1Δ. WT, mutant and reconstituted strains were spotted onto plates containing the various media as indicated, from 106 cells per drop to 10 cells per drop, and incubated for 2–4 days
Figure 5. Transmission electron microscopy (TEM) demonstrating that arg1Δ cell walls are thicker than, and structurally different to, those of WT and kcs1Δ, and that arg1Δ cells have larger vacuoles. N: nucleus; CW: cell wall; V: vacuole
Figure 6. arg1Δ cells, but not kcs1Δ cells, are enlarged and produce bigger vacuoles. Cells were allowed to endocytose the lipophilic dye, FM 4–64, for 40 min to label vacuoles (indicated by arrows in panels on the right). Differential interference contrast images are shown on the left
Figure 7. arg1Δ and kcs1Δ capsule size is reduced and increased, respectively, relative to WT. Cells were grown in minimal medium (broth) overnight. Capsules were visualized with India Ink stain under a light microscope at 100X magnification. The graph represents the mean ratio of capsule width to cell body diameter in each strain ± standard deviation (n = 51 cells). ###, P<0.001 using a Tukey-Kramer multiple comparison test
Figure 8. Blocked secretion of Plb1 in arg1Δ coincides with an increase in Plb1 molecular weight as assessed by Western blotting. (A) Plb1 in secretions and cell lysates was resolved by SDS-PAGE and detected using anti-Plb1 antibody. (B) PLB1 gene expression was quantified by qPCR. The results are the average of three biological replicates ± SD. ##, P < 0.01; ###, P < 0.001; n.s, not significant
Figure 9. N-linked mannosylation of Plb1 and secretome composition are altered in arg1Δ. Cryptococcal secretions, each containing 40 µg of protein, were collected from WT and arg1Δ, treated with PNGase F (+), resolved by SDS-PAGE and subjected to either (A) anti-Plb1 Western blotting, (B) glycoprotein staining or (C) glycoprotein staining followed by Commassie staining. In (C), the arrow indicates the position of the PNGase F enzyme
Figure 10. Arg1 is essential for lung colonization and dissemination in a murine inhalation model of cryptococcosis. (A) arg1Δ is avirulent compared to WT and arg1Δ + ARG1. Mice (n = 10 per strain) were inoculated intranasally with 5× 10⁵ cells/20 µL and monitored daily. Difference in survival between WT/arg1Δ + ARG1-infected mice and arg1Δ-infected mice is statistically significant (####P < 0.0001). (B) and (C) arg1Δ infection is rapidly cleared from mouse lung between 3 and 7 days post-infection. Mice (n = 3 per strain) were inoculated intranasally with 5× 10⁵ cells/20 µL and sacrificed on the days indicated. Lung and brain were harvested for quantitative culture (CFUs) (B) or histopathological analysis for lung only by Periodic acid–Schiff (PAS) staining (C). In (B), the difference in lung CFUs for WT and arg1Δ-infected mice at day 3 is statistically significant (#P < 0.05). In (C), lung histopathology is shown at 3 days post-infection (PAS stain, 40x magnification). In WT-infected lung tissue, arrows indicate cryptococcomas where capsular material is represented by white halos surrounding the cell bodies (stained magenta). In arg1Δ-infected tissue, arrows indicate single acapsular cryptococcal cells
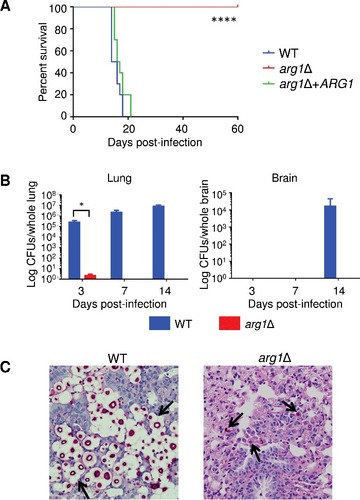
Figure 11. arg1Δ is more readily phagocytosed by human PBMCs. Results are expressed as the mean % of CD14+ monocytes containing FITC-labelled C. neoformans ± SD (n = 3). Statistical significance is indicated as follows: ###P < 0.001
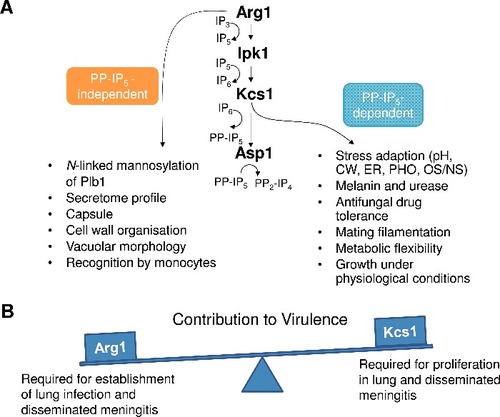
Figure 12. Summary of PP-IP5-dependent and –independent functions of Arg1 (A), and the contribution of Arg1 and Kcs1 to virulence (B). pH – alkaline pH stress; CW – cell wall stress induced by calcofluor white, Congo red, SDS, caffeine; ER – endoplasmic reticulum stress caused by tunicamycin and DTT; PHO – phosphate deprivation; OS/NS – oxidative and nitrosative stress, respectively