Figures & data
Figure 1. Comparison of several LPSs carrying different structure moieties in GM-DCs revealed a shield function of the Brucella core component. GM-DCs were non-treated (Mock) or stimulated with Bm-wt LPS, Bm-wadC LPS, Ochrobactrum anthropi 331 LPS, Yersinia enterocolitica O:9 LPS or E. coli LPS for 24 h. Brucella LPSs, Y. enterocolitica and O. anthropi LPS were used at the concentration of 10 μg/mL and E. coli LPS was at 100 ng/mL. (A) MHCII and co-stimulatory molecule levels of expression (MFI, Mean of Fluorescence Intensity) were measured by flow cytometry. (B) Cytokine secretion was determined in culture supernatants by ELISA. The graphs show combined data from at least three independent experiments. All error bars are standard deviations obtained from pooled data. Significant differences from mock or from Bm-wt LPS are shown. #, P < 0.05; ##, P < 0.001; ###, P < 0.0001; ####, P < 0.00001. ns, non-significant.
Figure 2. Unlike Bm-wt LPS, Bm-wadC LPS elicited cytokine secretion from human mo-DCs. Human GM-CSF and IL-4 derived mo-DCs were non-treated (Mock) or stimulated with Bm-wt LPS, Bm-wadC LPS or E. coli LPS for 72 h. All LPSs were used at a concentration of 20 ng/mL. Cytokine secretion was determined in culture supernatants by ELISA. The graphs show combined data from at least four independent experiments with n = 1 animal per condition. All error bars are standard deviations obtained from pooled data. Statistical analysis was performed with the parametric one-way ANOVA test, followed by variance analysis with the Tukey and Dunnett test. Significant differences from mock or from Bm-wt LPS were identical. ###, P < 0.0001; ####, P < 0.00001. ns, non-significant.
Figure 3. Bm-wt LPS preferentially triggered maturation of FL-DCs in vitro, while Bm-wadC LPS activated that of both GM-DC and FL-DC subsets. FL-DCs were non-treated (Mock) or stimulated for 24 h with Bm-wt LPS, Bm-wadC LPS, Ochrobactrum anthropi 331 LPS, Yersinia enterocolitica O:9 LPS or E. coli LPS. Brucella LPSs, Y. enterocolitica and O. anthropi LPS were used at the concentration of 10 μg/mL and E. coli LPS was at 100 ng/mL. (A) MHCII and co-stimulatory molecule expression levels (MFI, Mean of Fluorescence Intensity) were measured by flow cytometry. (B) Cytokine secretion was determined in whole FL-DC culture supernatants by ELISA. The graphs show combined data from at least three independent experiments. All error bars are standard deviations obtained from pooled data. Significant differences from mock only (A) or from mock or from Bm-wt LPS (B) are shown. #, P < 0.05; ##, P < 0.001; ###, P < 0.0001; ####, P < 0.00001. ns, non-significant.
Figure 4. Bm-wt LPS-treated FL-DCs primed little T cell proliferation in vitro, while Bm-wadC LPS elicited significant T cell proliferation by both GM- & FL-DCs. GM- or FL-DCs were incubated for 16 h with OVA and were non-treated (Mock) or treated with different Bm LPSs (10 μg/mL) or E. coli LPS (100 ng/mL) for 8 h. Stimulated DCs were co-cultured with CFSE-labelled T cells from OT-I or OT-II mice. Proliferation of T cells was assessed after 2 days of co-culture by CFSE incorporation and flow cytometry. (A) One representative experiment is shown out of 3 independent experiments for OT-I and out of 5 for OT-II. (B) Pooled data are presented as mean ± standard deviation. Significant differences from mock. Significant differences from mock or from Bm-wt LPS were identical. #, P< 0.05; ##, P < 0.001. ns, non-significant.
Figure 5. In vivo, LPSs favoured mobilisation of a mo-DC like cell type in a TLR4-dependent fashion. 6–8 weeks-old C57BL/6J mice were injected intraperitoneally with 1xPBS (PBS), Bm-wt LPS (30 μg/mouse), Bm-wadC LPS (20 μg/mouse) or E. coli LPS (10 μg/mouse). Quantities of injected LPS, calculated by KDO weight ratio, ensured equal molar weight for each of them. 4, 12, 24 and 48 h post-injection, mice were sacrificed, single-splenocyte suspensions were prepared and analysed by flow cytometry. (A) Dot plots of CD11b and BST-2 staining and absolute numbers of the CD11b+BST-2hi subset 12 h post-injection. (B) Absolute numbers of the CD11b+BST-2hi subset in spleen from injected mice at indicated time-points. (C) Dot plots of DC-SIGN and CD64 staining of the pDC, cDC and CD11b+BST-2hi subpopulations 12 h post-injection. (D) Dot plots of Ly6C and CD11b staining and absolute numbers of the CD11b+Ly6Chi monocytes 12 h post-injection. (E) Dot plots of CD11c and MHCII staining of the CD11b+Ly6Chi and CD11b+BST-2hi subpopulations 12 h post-injection. Data displayed from (A to E) are representative of 3 independent experiments, n = 3 mice per condition in each experiment. (F) 6–8 weeks-old TLR4+/+ or TLR4−/− mice were injected with PBS, Bm-wt LPS, Bm-wadC LPS or E. coli LPS as described above. 12 h later, mice were sacrificed, single-splenocyte suspensions were prepared and total CD11c+ cells were analysed by flow cytometry. Dot plots of BST-2 and CD11b staining is representative of 3 independent experiments, n = 3 mice per condition in each experiment.
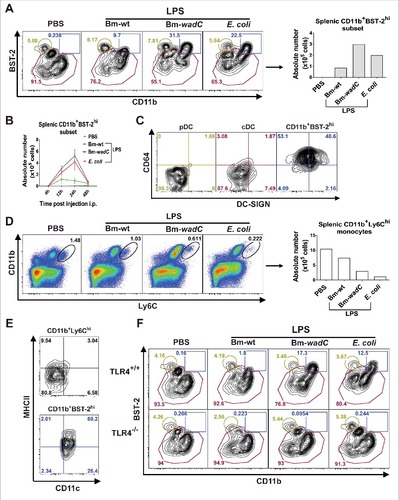
Figure 6. Bm-wt LPS poorly triggered phenotypic maturation of splenic DC subsets in vivo, in contrast to Bm-wadC LPS which promoted strong activation of DCs. 6–8 weeks-old C57BL/6J mice were injected intraperitoneally with 1xPBS (PBS), Bm-wt LPS (30 μg/mouse), Bm-wadC LPS (20 μg/mouse) or E. coli LPS (10 μg/mouse). 12 h later, mice were sacrificed, single-splenocyte suspensions were prepared and expression levels (MFI, Mean of Fluorescence Intensity) of MHCII, costimulatory molecules (CD86 and CD40) and inhibitory marker (PDL-1) on splenic DC subsets were determined by flow cytometry. Arrows point to the absence of data due to failure of mo-DC mobilisation by PBS. Data represent mean ± standard deviation of 3 independent experiments, each with n = 3 mice per condition. Statistical analysis was performed with the non-parametric one-way ANOVA test, followed by variance analysis with the Mann-Withney U test. Significant differences from PBS injected mice are shown; #, P < 0.05; ##, P < 0.001. ns, non-significant.
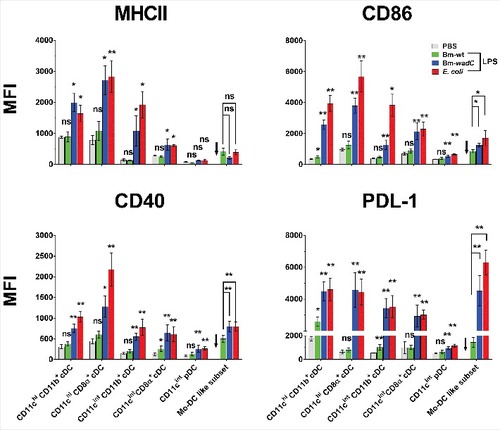
Figure 7. TLR4 was essential for LPS to drive maturation of splenic DCs. 6–8 weeks-old TLR4+/+ or TLR4−/- mice were intraperitoneally injected with 1xPBS (PBS), Bm-wt LPS (30 μg/mouse), Bm-wadC LPS (20 μg/mouse) or E. coli LPS (10 μg/mouse). 12 h later, mice were sacrificed, single-splenocyte suspensions were prepared and expression levels (MFI, Mean of Fluorescence Intensity) of costimulatory molecules (CD86 and CD40) on total splenic CD11c+ cells were determined by flow cytometry. Data obtained from 3 experiments, each with n = 3 animals per condition, are shown. All error bars are standard deviations obtained from pooled data. Statistical analysis was performed with the non-parametric one-way ANOVA test, followed by variance analysis with the Mann-Withney U test. Significant differences from TLR4+/+ injected mice are presented; ##, P < 0.01; ###, P < 0.001.
Figure 8. Bm-wadC mutant Brucella induced higher cytokine secretion than Bm-wt strain in infected mice. C57BL/6J mice were non-treated (Mock) or infected with B. melitensis 16M reference (Bm-wt) strain or Bm-wadC mutant strain for 8 days. Cytokine secretion was determined in sera by ELISA. Data obtained from 3 experiments, each with n = 3 animals per condition, are displayed. All error bars are standard deviations obtained from pooled data. Statistical analysis was performed with the parametric one-way ANOVA test, followed by variance analysis with the Tukey and Dunnett test. Significance was defined when P values were less than 0.05 (#, P < 0.05).