Figures & data
Table 1. S. aureus strains used in the study.
Figure 1. Neutralization of recombinant leukocidins by ASN-1 and ASN-2. A: Neutralization of recombinant HlgAB (10 nM), HlgCB (7.5 nM), LukED (10 nM) and LukSF-PV (5 nM) by ASN-1. B: Neutralization of LukGH (1 nM, TCH1516 LukGH) by ASN-2. C: left panel: Effect of individual toxins as in A, except for LukGH (1.875 nM each of the four LukGH variants expressed based on the MRSA252, MSHR1132, H19 and TCH1516 sequences) and a mixture thereof on PMN viability; right panel: Neutralization of a mixture of recombinant toxins by ASN-1, ASN-2 or ASN100 (1:1 mixture of ASN-1 and ASN-2). Antibody concentrations shown refer to individual mAbs. PMN viability was determined by luminescent quantification of cellular ATP levels. Data are derived from at least two independent experiments and shown as mean +/− SEM.
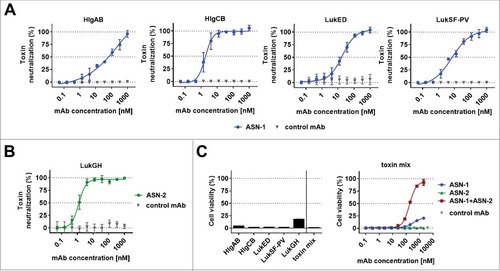
Figure 2. Toxin expression profiles and neutrophil toxicity of S. aureus isolates. A: Viability of human PMNs after exposure to serially diluted culture supernatants (CS) of USA300 CA-MRSA TCH1516 strain (left panel) and its isogenic Δhla/hlgABC/lukED/lukSF-PV/lukGH mutant (“TCH1516Δalltox“, right panel) grown in the indicated growth media. B: PMN toxicity of seven S. aureus strains expressed as CS dilution at the EC50. #) toxicity too low for EC50 calculation. PMN viability was determined by luminescent quantification of cellular ATP levels. Data are expressed as mean +/− SEM of three independent experiments. C: Immunoblot analysis of CS of seven S. aureus strains grown in the indicated media; control, recombinant toxin (0.1 µg/lane).
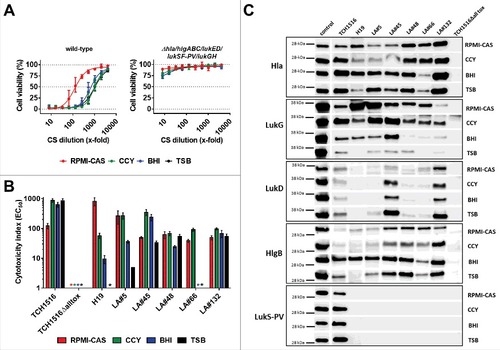
Figure 3. Synergistic effect of ASN-1 and ASN-2 in neutralizing native S. aureus cytotoxins in bacterial culture supernatants (CS). A: Human PMNs were exposed to CS of TCH1516 (at 8x dilution) and isogenic toxin gene deletion mutants grown in RPMI-CAS, in the presence of control antibody, ASN-1, ASN-2 or ASN100 (1 µM each). Data are shown as mean +/− SEM of two independent experiments. Viability was determined by luminescent quantification of cellular ATP levels. B: Calcein-AM/EthD-1 live/dead cell staining of human neutrophils after exposure to CS of TCH1516 (at 10x dilution) in the presence of ASN-1, ASN-2 and ASN100 (1 µM each) for 90 min. Live cells stained green, dead cells appear in red.
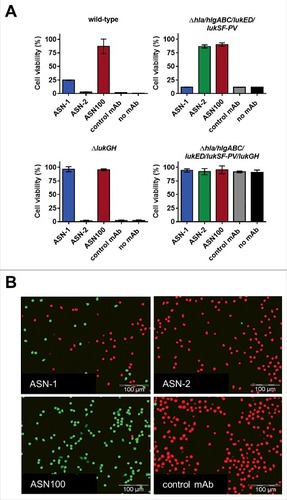
Figure 4. Individual contributions of ASN-1 and ASN-2 to PMN protection are strain and growth condition dependent. S. aureus isolates were grown in the indicated media, culture supernatants (at 16x dilution) were tested for PMN toxicity in the presence of ASN-1, ASN-2 and ASN100. A: Three representative isolates grown in different media. B: Six prototype strains and six clinical isolates grown in RPMI-CAS. PMN viability was determined by luminescent quantification of cellular ATP levels. MAbs were used at 1 µM each. Data are shown as mean +/− SEM of three independent experiments.
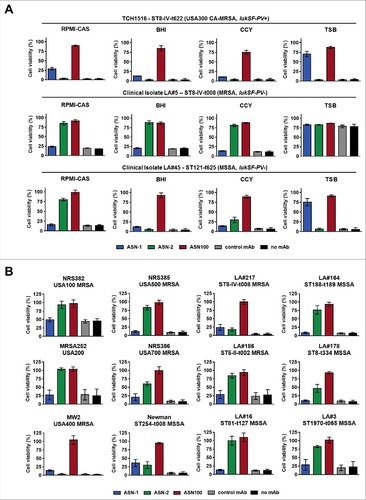
Figure 5. Effect of ASN100 during PMN ex vivo infection. Human PMNs were infected with different S. aureus strains at a MOI 50 for 2 hours. PMN viability was determined using a Calcein-AM viability dye. A: TCH1516 and isogenic mutant strains, mAbs used at 1 µM each. B: Data summary of TCH1516 and 16 additional clinical isolates, ##p ≤ 0.01 and ###p ≤ 0.001 using one-way ANOVA with Dunn's multiple comparison test. Data are presented as mean +/− SEM of two independent experiments. C: May-Grünwald Giemsa staining of human PMNs 2 hours after infection with TCH1516, 100x magnification.
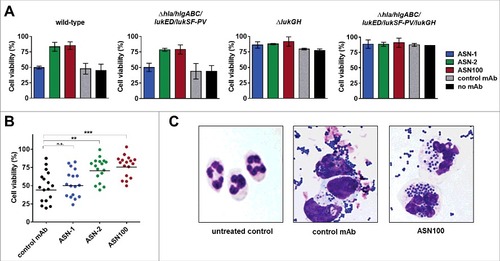
Figure 6. Protection of white blood cells by ASN100. Human peripheral WBCs were exposed to pooled BHI CS fractions of seven S. aureus strains for 2 hours and then stained with fluorescent antibodies specific for CD3, CD56, CD14, and CD19. Side-scatter and CD14 expression were used to discriminate lymphocyte, granulocyte and monocyte populations. T-cells, NK-cells and B-cells in the lymphocyte gate were further subtyped based on CD3, CD19 and CD56 expression. A: Representative plots showing untreated control cells and CS-exposed cells in presence of control mAb and ASN100. B: Data summary of 3 independent experiments using ASN-1, ASN-2 and ASN100. Data are shown as mean +/− SEM.
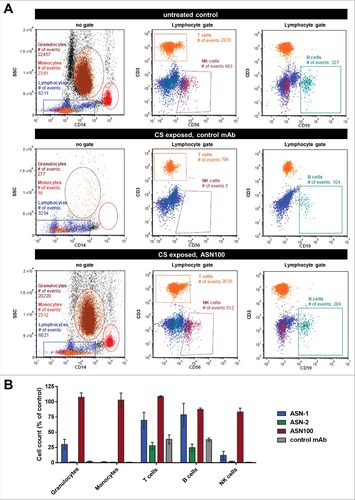
Figure 7. ASN100 prevents Hla-mediated tissue damage in a human 3D lung tissue infection model. EpiAirway™ tissues were infected with S. aureus TCH1516 at MOI 100 for 24 hours in the presence of control mAb, ASN-1, ASN-2 or ASN-100 (2 µM each). A: H&E staining of tissues. B: LDH release measured from basolateral compartment. C: LDH release measured with wild-type and gene deletion mutant TCH1516 strains in absence of mAbs. D: Relative increase in bacterial CFUs determined in the apical compartment. E: Viability of human neutrophils exposed to toxins produced in the control mAb sample in the presence of ASN-1, ASN-2 and ASN100 (1 µM each). Error bars indicate mean +/− SEM from duplicate measurements.
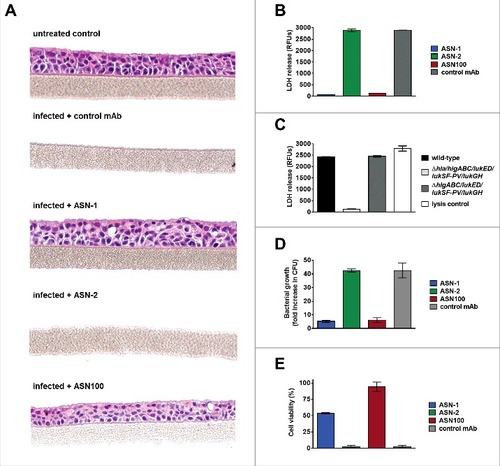
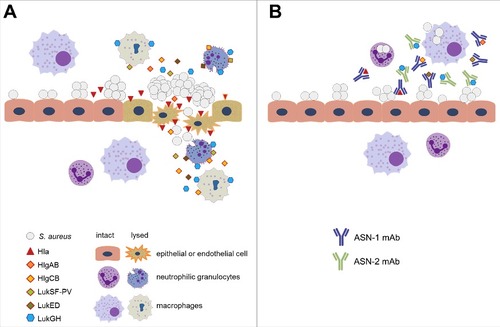
Figure 8. Proposed model for the role of S. aureus cytotoxins in pathogenesis and mode of action of ASN100. A: As bacterial density increases on mucosal surfaces, S. aureus secretes up to six cytolytic toxins. Alpha-hemolysin (Hla) lyses epithelial and endothelial cells allowing invasion to otherwise sterile body parts (e.g. lung, connective tissue) and promoting S. aureus disease (e.g. pneumonia, deep tissue infection). Up to five different leukocidins that primarily attack phagocytic cells, such as alveolar and tissue macrophages and granulocytes are also released, leading to weakened host defense and slower elimination of S. aureus. B: ASN-1 that neutralizes Hla and four leukocidins and ASN-2 that is specific for the fifth leukocidin (LukGH) inhibit cytotoxicity of S. aureus, which allows preservation of tissue integrity and immune defense during infection.