
Figures & data
Figure 1. Survival of SBSEC strains in blood and in the presence of macrophages. (A, B) Bacteria (2 × 10⁶ CFU, inoculum) were incubated in citrated blood for 3 hours. Serial dilutions of the samples were plated on BHI agar plates to determine CFU after incubation overnight. (C, D) Bacteria were set to 1 × 10⁷ CFU/ml (inoculum) and preincubated with plasma (1:1). Incubation was followed by the addition of J774 cells (1 × 10⁶ cells/ml). After incubation CFU were determined by plating. Percentage of viable bacteria was calculated in reference to the inoculum. Data represents mean values ± standard deviation, whereas mean values result from three independent biological experiments. Significance values were calculated using the Welch's t-test. # – p < 0.05, ## – p < 0.01, ### – p < 0.001
Table 1. SBSEC strains.
Figure 2. Clotting of blood and plasma after incubation with SBSEC strains. (A) Bacteria (2 × 10⁸ CFU/ml) were added to the same volume of blood. Buffer alone was employed as controls. After incubation for 30, 60, 120 or 240 min at 37°C the recalcification clotting times were measured. (B, C, D) 2 × 10⁸ CFU/ml bacterial overnight cultures were incubated in human plasma for 30 min at 37°C. Plasma incubated with buffer was used as control. Bacteria were removed and the aPTT (B, D) or the PT (C) of the supernatant was determined in a coagulometer. Data represent mean values ± standard deviation, whereas mean values result from three independent biological measurements. Significance values calculated in reference to control using the Welch's t-test. # – p < 0.05, ## – p < 0.01, ### – p < 0.001
Figure 3. Activation of FXII/PK on the bacterial surface of 5 SBSEC strains (A) and Sgg UCN34 and its mutant strains (B). Bacteria were incubated in HEPES buffer (neg. control), normal human plasma, PK- and FXII-deficient plasma or normal human plasma preincubated with the inhibitor H-D-Pro-Phe-Arg-CMK. After a washing step, bacteria were incubated with the chromogenic substrate S-2303 and absorbance at 405 nm was determined. Data represents mean values ± standard deviation, whereas mean values result from three independent biological measurements. Significance values were calculated in reference to the control using the Welch's t-test. # – p < 0.05, ## – p < 0.01, ### – p < 0.001
Figure 4. Scanning electron microscopy of Sgg UCN34 and its mutants incubated with plasma. Representative scanning electron micrographs of bacteria incubated in plasma or PBS. (A) Sgg UCN34 wildtype in PBS, (B) Sgg UCN34 wildtype in plasma, (C) Δpil1 in PBS, (D) Δpil1 in plasma, (E) Δpil3 in PBS, (F) Δpil3 in plasma, (G) ΔcpsD mutant in PBS (H) ΔcpsD mutant in plasma. Scale bars represent 200 nm.
Figure 5. Cleavage of HK at the surface of Sgg UCN34 and release of bradykinin. (A) Bacteria (108 CFU/ml) were incubated with human plasma for 15 min. After washing, bacteria-bound proteins were eluted with a glycine buffer (eluate). Eluate and supernatants were then separated on SDS-PAGE, transferred to Immobilon filters, and immunostained with a polyclonal antibody against HK. Ctrl: non-activated plasma; pos. Ctrl.: plasma activated with DAPPTIN; Lane 1: eluate of Sgg UCN34; lane 2: supernatant of Sgg UCN34; lane 3: eluate from Δpil1 mutant; lane 4: supernatant from Δpil1 mutant; lane 5: eluate from Δterm; lane 6: supernatant from from Δterm; lane 7: eluate from Δpil3 mutant; lane 8: supernatant from Δpil3 mutant; lane 9: eluate from ΔcpsD mutant; lane 10: supernatant from ΔcpsD mutant. B) Bacteria were incubated in plasma, washed, and further incubated in HEPES for 15 min. After centrifugation, bradykinin was determined in the supernatant. Data represents mean values ± standard deviation, whereas mean values result from three independent biological measurements. Significance values were calculated in reference to Sgg UCN34 using the Welch's t- test. # – p < 0.05, ## – p < 0.01, ### – p < 0.001
Figure 6. Binding of FXII to recombinant pilus protein. (A) Dot blot overlay was performed after immobilization of recombinant Sgg UCN34 pili proteins Gallo 2178 or 2179 in amounts of 2.5 µg, 2 µg, 1.5 µg, 1.25 µg, 1 µg and 0.5 µg onto a nitrocellulose membrane. Human FXII was used for protein overlay. Binding was detected with polyclonal FXII-specific antibodies and Irdye labeled secondary antibody followed by fluorescence detection. (B, C) A fluorescent label (NT-647) was covalently attached to Gallo2179 protein (NHS coupling). The concentration of NT-647 labeled Gallo2179 was kept constant, while the concentration of the non-labeled molecule FXII or HK varied between 6.25 μM – 0.19 nM (B) or 4.15 μM – 0.12 nM (C). Concentrations on the x-axis are plotted in nM. A Kd of 12.89 nM was determined for the interaction of FXII with Gallo2179 (B).
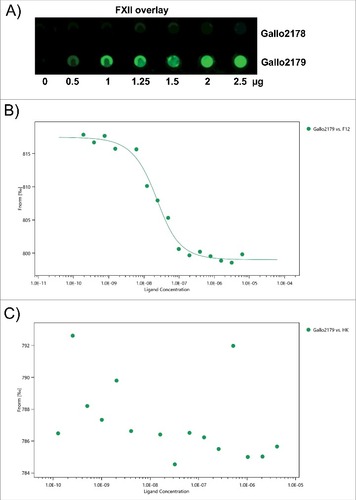
Figure 7. Pilus polymerization in SBSEC strains. Western blot analysis of cell wall protein extracts isolated from Sgg UCN34, Δpil1 mutant, Δpil3 mutant and Sii strains separated with 4%–12% Criterion XT sodium dodecyl sulfate–polyacrylamide gel electrophoresis and detected by means of immunoblotting using specific anti-Pil1 (left) or anti-Pil3 (right) polyclonal antibodies (pAbs). Equivalent amount of total proteins was loaded in each well.
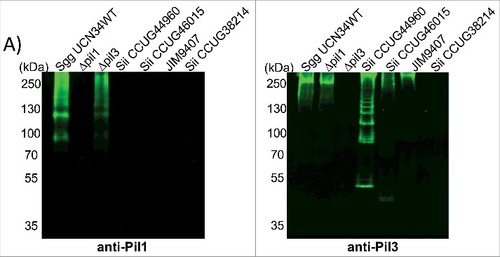
Table 2. Mutants of the Sgg UCN34 wild type strain.