
Figures & data
Figure 1. IsaA expression in S. aureus and other staphylococcal species. Detection of IsaA production in (A) sequenced S. aureus strains and (B) 25 clinical S. aureus isolates (A – Y) by Western blotting and immunodetection with 1D9-800CW. (C) Western blotting analysis for IsaA detection in spa and spa sbi mutants of S. aureus Newman, E. coli DH5α, B. subtilis 168 and several different staphylococcal species. Left panel, immunodetection of IsaA with unlabeled 1D9 and a secondary IRDye800CW-labeled goat anti-human antibody; right panel immunodetection with 1D9-800CW. Purified His6-IsaA was used as a control. (D) Western blotting analysis to verify the absence of IsaA production in S. aureus MS001 (ΔisaA) using 1D9-800CW for immunodetection. C, cell fraction; M, growth medium fraction. The positions of molecular weight markers are indicated on the left, and the positions of IsaA, an IsaA degradation product (#), Protein A and Sbi are indicated on the right.
Figure 2. Human post-mortem implant model. For near-infrared fluorescent imaging of staphylococcal cells in a human post-mortem model, overnight grown cultures of S. aureus MS001 (ΔisaA), S. aureus SH1000 (wt), S. aureus Newman Δspa Δsbi (Δspa Δsbi) and S. epidermidis 1457 in TSB (5 × 10⁸, CFU) were collected, washed twice with PBS, resuspended in 100 µl of PBS, and incubated with 5µg of 1D9-800CW. Upon 20 min incubation at room temberature, cells were washed twice with PBS and resuspended in 100 µl of PBS. Of this suspension with fluorescently labeled cells, 50 µl aliquots were spotted on filter paper strips (Whatman), and placed inside sealed plastic wrapping. Visible light and fluorescence images were recorded prior to and during surgical implantation onto the distal tibia of a human post-mortem leg. Fluorescence imaging was performed using an intraoperative clinical multispectral fluorescence eXplorer Air camera (SurgVision BV). Fluorescence signals were collected 0.5 sec (before implantation) and 0.2 sec (during implantation) with low binning and excitation/emission wavelengths of 740/845 nm.
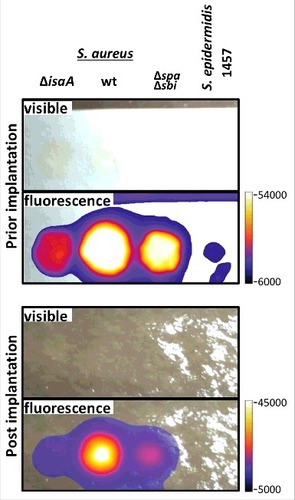
Figure 3. In vivo IsaA-specific optical imaging of S. aureus infection with 1D9-800CW. Six to eight weeks old C57BL/6 female mice were shaved on the flanks and back, and mid-logarithmic growth phase S. aureus SH1000 lux (wt) and ΔisaA S. aureus MS001 lux (5 × 107 CFUs in 100 μl of sterile saline) were each injected intradermally into opposite flanks of each mouse (n = 7 performed over 3 independent experiments). In a second group of mice, E. coli Xen14 (Ec; 5 × 10⁷ CFUs in 100 μl of sterile saline) and lipopolysaccharide (LPS; 1 mg/kg in 100 μl of sterile saline) were injected intradermal into opposite flanks of each mouse (n = 4 performed over 1 experiment). Inoculations were performed on t-1. Control images were recorded 1 day prior to inoculation (t-2). One day post bacterial inoculation (t0) or 1 h after LPS injection, 1D9-800CW (2.5 mg/kg in 100 µl sterile saline warmed to 37°C) was injected retro-orbitally and images were subsequently recorded at different time points as indicated. The fluorescent (total radiant efficiency [photons/s]/[mW/cm2]) and bioluminescent signals (total radiance [photons/s]) were measured with a 1.2 × 1.2 cm region of interest (ROI) centered over the site of skin infection/inflammation. (A) NIR fluorescence images of representative mice were collected at 0.5 sec with medium binning and excitation/emission wavelengths of 740/845 nm. (B) Mean total radiant efficiency (photons/s)/(mW/cm2) ± s.e.m. of the in vivo fluorescent signals. (C) Bioluminescence images of representative mice were collected for 60 sec with medium binning. (D) Mean total flux (photons/sec) ± s.e.m. (logarithmic scale) of in vivo bioluminescent signals. (E) Representative NIR fluorescence images of different organs collected on day 2 for assessment of 1D9-800CW accumulation. In panels B and D, variations are indicated with error bars and statistically significant differences with different symbols for each curve (# = P<0.05; † = P<0.01; ‡ = P<0.001).
![Figure 3. In vivo IsaA-specific optical imaging of S. aureus infection with 1D9-800CW. Six to eight weeks old C57BL/6 female mice were shaved on the flanks and back, and mid-logarithmic growth phase S. aureus SH1000 lux (wt) and ΔisaA S. aureus MS001 lux (5 × 107 CFUs in 100 μl of sterile saline) were each injected intradermally into opposite flanks of each mouse (n = 7 performed over 3 independent experiments). In a second group of mice, E. coli Xen14 (Ec; 5 × 10⁷ CFUs in 100 μl of sterile saline) and lipopolysaccharide (LPS; 1 mg/kg in 100 μl of sterile saline) were injected intradermal into opposite flanks of each mouse (n = 4 performed over 1 experiment). Inoculations were performed on t-1. Control images were recorded 1 day prior to inoculation (t-2). One day post bacterial inoculation (t0) or 1 h after LPS injection, 1D9-800CW (2.5 mg/kg in 100 µl sterile saline warmed to 37°C) was injected retro-orbitally and images were subsequently recorded at different time points as indicated. The fluorescent (total radiant efficiency [photons/s]/[mW/cm2]) and bioluminescent signals (total radiance [photons/s]) were measured with a 1.2 × 1.2 cm region of interest (ROI) centered over the site of skin infection/inflammation. (A) NIR fluorescence images of representative mice were collected at 0.5 sec with medium binning and excitation/emission wavelengths of 740/845 nm. (B) Mean total radiant efficiency (photons/s)/(mW/cm2) ± s.e.m. of the in vivo fluorescent signals. (C) Bioluminescence images of representative mice were collected for 60 sec with medium binning. (D) Mean total flux (photons/sec) ± s.e.m. (logarithmic scale) of in vivo bioluminescent signals. (E) Representative NIR fluorescence images of different organs collected on day 2 for assessment of 1D9-800CW accumulation. In panels B and D, variations are indicated with error bars and statistically significant differences with different symbols for each curve (# = P<0.05; † = P<0.01; ‡ = P<0.001).](/cms/asset/4d356012-02d5-4bd7-805a-03b8693ea63f/kvir_a_1403004_f0003_oc.jpg)
Figure 4. Distinction of S. aureus and E. coli infection by optical imaging with 1D9-800CW. Mice were inoculated intradermally in opposite flanks with bioluminescent S. aureus SAP231 (SAP) and E. coli Xen14 (Ec) as described for . Images were recorded at different time points pre and post intravenous administration of 2.5 mg/kg 1D9-800CW. (A) NIR fluorescence images of representative mice were collected with excitation/emission wavelengths of 740/845 nm. (B) Mean total radiant efficiency (photons/s)/(mW/cm2) ± s.e.m. of the in vivo fluorescent signals. (C) Bioluminescence images of representative mice. (D) Mean total flux (photons/sec) ± s.e.m. (logarithmic scale) of in vivo bioluminescent signals. In panels B and D, variations are indicated with error bars and statistically significant differences with different symbols for each curve (# = P<0.05; † = P<0.01; ‡ = P<0.001).
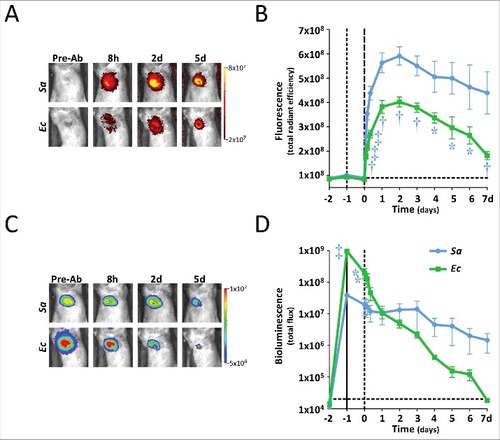
Figure 5. In vivo IsaA-specific PET imaging of S. aureus infection with 89Zr-1D9. Mice were inoculated intradermally in opposite flanks with either S. aureus SH1000 (wt) or S. aureus MS001 (ΔisaA) as described for (t-1). One day post inoculation (t0), 0.7 mg/kg 89Zr-1D9 was administered intravenously and images were subsequently recorded at different time points as indicated. List-mode data were acquired using a gamma-ray energy window of 350 to 750 keV and a coincidence timing window of 6 ns. PET imaging data were corrected for detector non-uniformity, dead time, random coincidences, and physical decay. For all static images, scan time was between 10 and 20 min. (A) PET images of representative mice [arrows = wt infection; arrowheads = ΔisaA infection; # = knee joint; & = heart]. (B) PET total activity (µCi) at the site of infection. In panel B, variations are indicated with error bars and statistically significant differences with an asterisk (# = P<0.05).
![Figure 5. In vivo IsaA-specific PET imaging of S. aureus infection with 89Zr-1D9. Mice were inoculated intradermally in opposite flanks with either S. aureus SH1000 (wt) or S. aureus MS001 (ΔisaA) as described for Fig. 3 (t-1). One day post inoculation (t0), 0.7 mg/kg 89Zr-1D9 was administered intravenously and images were subsequently recorded at different time points as indicated. List-mode data were acquired using a gamma-ray energy window of 350 to 750 keV and a coincidence timing window of 6 ns. PET imaging data were corrected for detector non-uniformity, dead time, random coincidences, and physical decay. For all static images, scan time was between 10 and 20 min. (A) PET images of representative mice [arrows = wt infection; arrowheads = ΔisaA infection; # = knee joint; & = heart]. (B) PET total activity (µCi) at the site of infection. In panel B, variations are indicated with error bars and statistically significant differences with an asterisk (# = P<0.05).](/cms/asset/9f8f5a19-9c62-4efe-8cc8-31c7841b44cd/kvir_a_1403004_f0005_oc.jpg)