Figures & data
Table 1. Strains of S. pseudintermedius with their sequence types and methicillin resistance.
Figure 1. Expression levels of spsQ in S. pseudintermedius. qPCR was performed to measure the amount of spsQ mRNA in log phase bacterial cells. Relative gene expression was calculated using the 2−ΔΔCT method and expressed as fold change. 16S rRNA was used as the endogenous control. The values represent average from three independent experiments. (#P < 0.05 was considered significant). #spsQ mRNA levels in isolates NA12, NA45, KM241, 08–1791, 08–1721, 07–1447 and 57395 were below the detection limits of the assay.
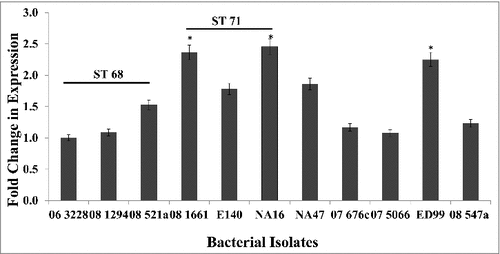
Figure 2. Binding of canine IgG to protein A on S. pseudintermedius (dose-response). A dose-response effect observed when varying concentrations of canine IgG ranging from 10 μg/ml-1000 μg/ml was reacted with S. pseudintermedius. The values represent average from three independent experiments. (P < 0.05 was considered significant). Data for isolates representing ST 68 (06-3228), ST 71 (08-1661) and ST 84 (NA45) have been presented.
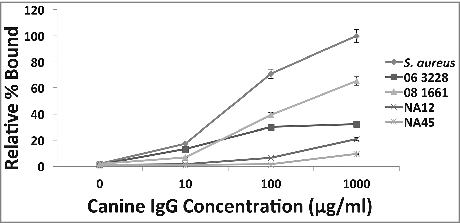
Figure 3. Canine IgG recognizes and binds to protein A on S. pseudintermedius. Isolates representing various sequence types of S. pseudintermedius were reacted with 100μg/ml of canine IgG. The amount of binding was determined by flow cytometry and expressed as percentage bound relative to the positive control S. aureus Cowan 1 strain. The values represent average from three independent experiments. (#P < 0.05 was considered significant).
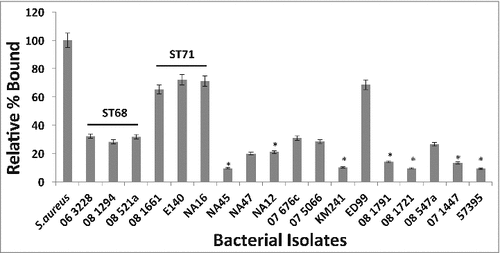
Figure 4. Protein A in S. pseudintermedius binds to canine IgG primarily via its Fc region. S. pseudintermedius isolates were treated with IgG and its papain digestion fragments, Fab and Fc. The amount of binding was determined by flow cytometry. The values represent average from three independent experiments. (#P < 0.05 was considered significant). Data for isolates representing ST 68 (06-3228), ST 71 (08-1661) and ST 84 (NA45) are presented.
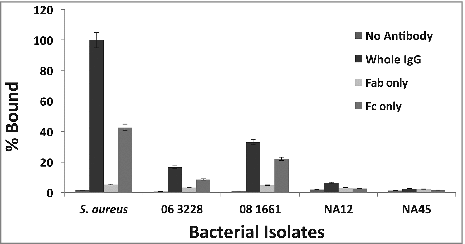
Figure 5. Protein A on the surface of S. pseudintermedius. The density of cell wall-associated protein A in various strains of S. pseudintermedius was measured using FITC-conjugated anti-protein A antibody by flow cytometry. The values represent the average from three independent experiments. (#P < 0.05 was considered significant).
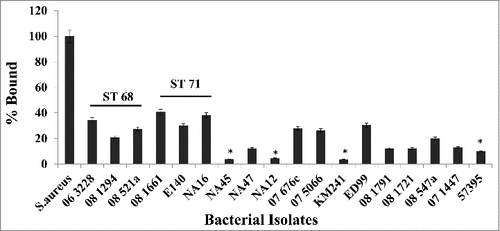
Figure 6. Binding of anti-protein A antibody prevents the binding of canine Fc to protein A on S. pseudintermedius. Bacterial isolates were incubated with an excess of chicken anti-protein A antibody prior to the addition of canine Fc. There was at least 50% reduction in the binding of canine Fc because of anti-protein A antibody binding. The values represent average from three independent experiments. (#P < 0.05 was considered significant). Data for isolates representing ST 68 (06-3228), ST 71 (08-1661) and ST 84 (NA45) are presented.
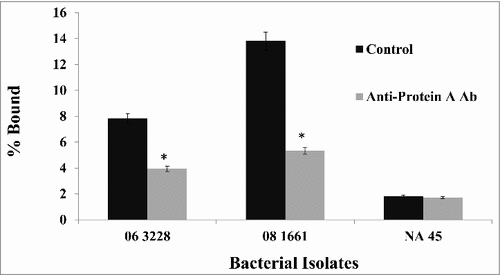
Figure 7. Production of extracellular protein A in S. pseudintermedius. The amount of extracellular protein A was measured using an antigen-capture ELISA. Commercially available protein A from S. aureus was used to generate the standard curve. The values represent the average from three independent experiments. (#P < 0.05 was considered significant).
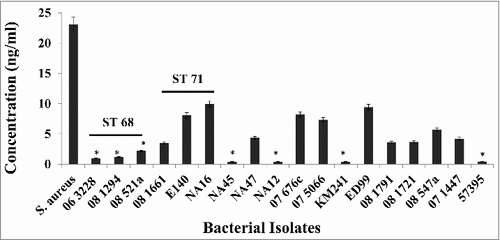
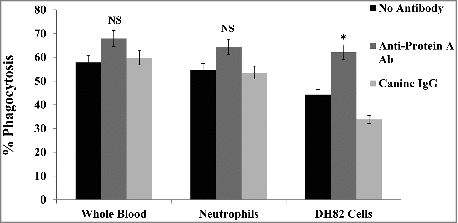
Figure 8. Phagocytosis of S. pseudintermedius. The involvement of protein A in immune evasion was demonstrated by phagocytosis using pHrodo™ Red-labeled 08–1661 in whole blood, neutrophils and DH82 cells. Pre-incubation of bacteria with anti-protein A antibody enhanced phagocytosis (red). The values represent average from three independent experiments. (#P < 0.05 was considered significant). NS – not significant.