Figures & data
Figure 1. Transcriptional activation of G. mellonella IMPI homologs in response to pathogenic strains of M. robertsii. Expression levels were determined by RT-PCR relative to the same genes in untreated last-instar larvae and were normalized against the 18S rRNA gene. Data are means of three independent measurements ± standard deviations.
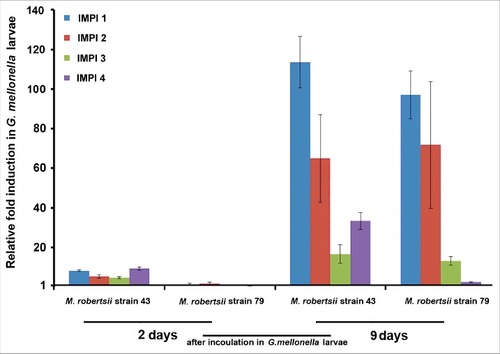
Figure 2. Germination of M. robertsii conidia in the presence of antimicrobial peptides and proteinase inhibitors. Conidia of M. robertsii strains 43 and 79 were inoculated in gelatin supplemented with trypsin inhibitor, metchnikowin, IMPI or lysozyme. Germination frequencies were measured 26 h post-inoculation. Data are means of three independent experiments ± standard errors (###p<0.001, ##p<0.01, #p<0.05; treatments compared to untreated controls).
Figure 3. Extracellular proteinase activity of M. robertsii in the presence of antimicrobial peptides and proteinase inhibitors. (A) Nonspecific extracellular proteinase activity in M. robertsii strains 43 and 79 following the application of trypsin inhibitor, metchnikowin, IMPI or lysozyme was determined by fluorimetry using casein as a substrate. (B) Metalloproteinase activity was determined using the fluorigenic peptide Mca-RPPGFSAFK (Dnp)-OH as a substrate. Data are means of three independent experiments ± standard errors (###p<0.001, ##p<0.01, #p<0.05; treatments compared to untreated controls).
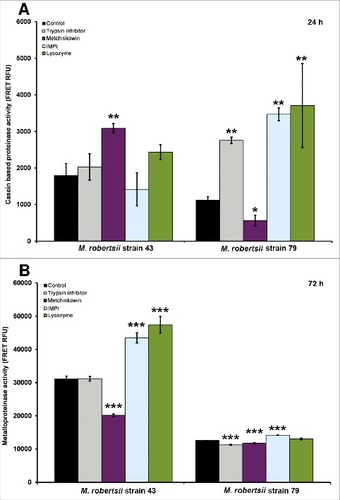
Figure 4. Differential expression of M. robertsii chy1 in response to proteinase inhibitors and antimicrobial peptides. The expression of M. robertsii chy1 after (A) 3 d and (B) 6 d exposure to gelatin and gelatin supplemented with trypsin inhibitor, metchnikowin, IMPI or lysozyme was determined by RT-PCR relative to expression levels in PDA without antimicrobial compounds or proteinase inhibitor. Metarhizium robertsii strains 43 and 79 inoculated in gelatin were used as controls. Values were normalized against the housekeeping gene gpd. Data are means of three independent experiments ± standard errors (###p<0.001, ##p<0.01, #p<0.05; treatments compared to untreated controls).
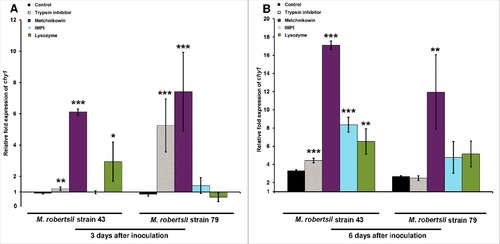
Figure 5. Differential expression of M. robertsii mep1 in response to proteinase inhibitors and antimicrobial peptides. The expression of M. robertsii mep1 after (A) 3 d and (B) 6 d exposure to gelatin and gelatin supplemented with trypsin inhibitor, metchnikowin, IMPI or lysozyme was determined by RT-PCR relative to expression levels in PDA without antimicrobial compounds and proteinase inhibitors. Metarhizium robertsii strains 43 and 79 inoculated in gelatin were used as controls. Values were normalized against the housekeeping gene gpd. Data are means of three independent experiments ± standard errors (###p<0.001, ##p<0.01, #p<0.05; treatments compared to untreated controls).
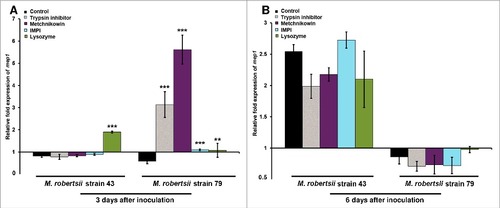
Figure 6. Detection of multiply-charged pseudomolecular ions of metchnikowin. (A-B) Extracted ion current of the 5+ (m/z = 606.0) and 4+ (m/z = 757.5) charged pseudomolecular ions of metchnikowin following inoculation in PDB containing M. robertsii strains 43 or 79 at time point 0. (C-D) Corresponding data 72 h after inoculation for strain 79. (E-F) Corresponding data 72 h after inoculation for strain 43. The close-up shows the ESI+ mass spectrum in the m/z range 500–1100 (tR 19.1–19.7 min).
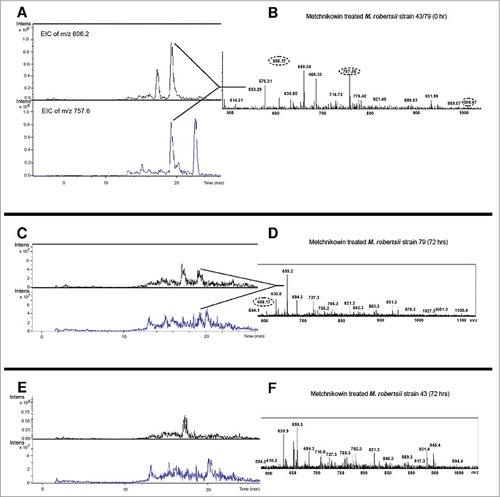
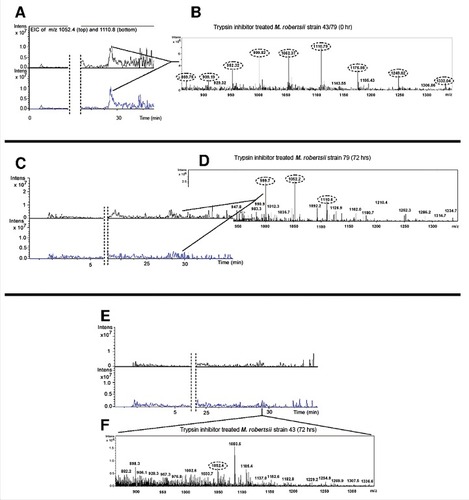
Figure 7. Detection of multiply-charged pseudomolecular ions of trypsin inhibitor. (A-B) Extracted ion current of the 5+ (m/z = 1052.4) and 4+ (m/z = 1110.8) charged pseudomolecular ions of trypsin inhibitor following inoculation in PDB containing M. robertsii strains 43 or 79 at time point 0. (C-D) Corresponding data 72 h after inoculation for strain 79. (E-F) Corresponding data 72 h after inoculation for strain 43. The close-up shows the ESI+ mass spectrum in the m/z range 800–1400 (tR 28.9–29.7 min).