Figures & data
Figure 1. Val1686 contributes to the delay of cell rounding and nuclear fragmentation, and the inactivation of Rho family GTPase in fish cells during the V. alginolyticus infection. (A) FHM cells were infected with ZJO, ZJOΔval1686 (Δval1686) and ZJOΔval1686:pval1686 (Δval1686:pval1686). Cells were visualized under a fluorescence microscopy using rhodamine phalloidin to stain actin (red) and Hoechst to stain nuclei (blue) at indicated time points after infection. Arrows indicate fragmented nuclei (apoptotic bodies), while arrowheads indicate condensed nuclei. Scale bar: 10 µm. (B) FHM cells were infected with ZJO and ZJOΔval1686 (Δval1686) and cell lysate were prepared as described in Materials and Methods. The lysates were incubated with (+) or without (-) GTPγS as indicated, followed by GTPases pulldown assays. Active Rho or Cdc42 (GTP-bound) were detected using corresponding antibodies. Upper panels indicate active GTPase, while middle panels represent total cellular GTPase, which were detected from total cleared lysates. Lower panels represent β-actin loading controls. Uninfected FHM cells were included as controls (Ctrl) in this assay.
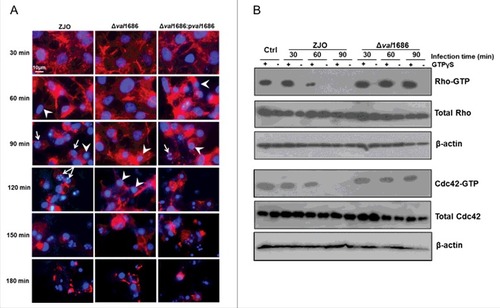
Figure 2. Val1686 is required for V. alginolyticus T3SS-induced apoptosis. (A) TUNEL assay. FHM cells were either uninfected, or infected (m.o.i. = 10) with wild-type ZJO (WT), deletion mutant and complementation strains as indicated. At 1 h and 2 h after infection, DNA fragmentation was detected by TUNEL staining. TUNEL-positive cells were quantified from three independent experiments and the data are presented as means ± SEM. At least four fields under light microscopy (40 × objective) were randomly selected and examined for each experiment. (B) Measurement of caspase-3 activity of infected cells as described for TUNEL assay. The data are expressed as fold-increase compared to the corresponding values of caspase activity in uninfected cells (Ctrl) (error bars = SEM; 3 independent experiments). Statistical analysis was performed by using a Kruskal Wallis test followed by a Tukey-Kramer multiple comparisons test between the treatment groups and the control. Asterisks indicate significance for both 1- and 2-hour time points compared to controls (###; P < 0.001).
Figure 3. Val1686 alone is sufficient to induce apoptosis in transfected cells. (A) FHM cells were transfected with the plasmids pEGFP-N3, pEGFP_val1686, pEGFP_val1686Δ30 or pEGFP_val1686 H348A and visualized with fluorescence microscopy. Green fluorescence shows GFP alone (as control), or GFP fusion proteins (Val1686-GFP, Val1686Δ30-GFP, Val1686H348A-GFP). Nuclei were stained by using Hoechst33258 (blue). Arrows indicate the fragmented nuclei. (B) FHM cells were respectively transfected with the plasmids pcDNA3.1, pcDNA_val1686, pcDNA_val1686Δ30 or pcDNA_val1686 H348A and harvested for caspase-3 activity assay. The data are expressed as fold-increase compared to the corresponding values of caspase activity in uninfected cells (Ctrl) (3 independent experiments). (No statistical significance observed, P = 0.02)
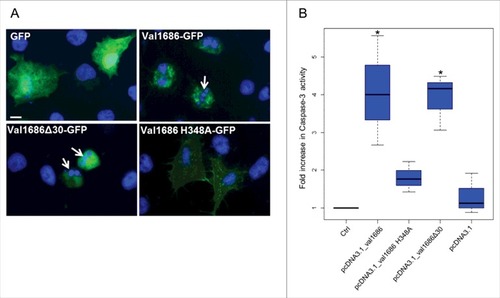
Figure 4. Western blot analysis of Val1686 secretion. Overnight cultures of Δval1686 strain and several complemented strains. Complementation included strains that synthesis native Val1686 (pval1686) or Val1686 without the first 30 amino acids (pval1686Δ30; negative control), or Val1686 having an amino acid change (histidine to alanine, position 348; pval1686 H348A) or Val1686 lacking the Fic domain (pval1686ΔFic). Equal volume (10 μL) of prepared samples were loaded onto SDS-PAGE gel and the histidine tag in C-terminus was probed for individual recombinant protein in western blot. Anti-DnaK was used as a loading control. The data are representative of three repeated experiments.
Figure 5. Val1686 induced-apoptosis depends on caspases activation. (A) Measurement of caspase-8, -9 and -10 activity. FHM cells were either uninfected (Ctrl), or infected with wild-type ZJO (WT), Δval1686 or ΔvscC. caspase-8, -9 and -10 activity assays were conducted after 2 h infection. (B) Inhibitory effect of three caspase inhibitors on V. alginolyticus-induced apoptosis. FHM cells were pre-incubated for 1 h with 20 μM of caspase-8 inhibitor (Q-IETD-Oph), caspase-9 inhibitor (Q-LEHD-Oph) and negative control inhibitor (Q-VE-Oph) and then infected with wild-type ZJO. Inhibitory effects on apoptosis were evaluated using the caspase-3 activity assay. (C) Inhibitory effect of three caspase inhibitors on caspase-8 and caspase-9 activity. FHM cells were treated as in (A) and measured for caspase-8 and -9 activity. The data are expressed as fold-increase compared to the corresponding values of caspase activity in uninfected cells (Ctrl) (3 independent experiments). A Kruskal Wallis test followed by a Tukey-Kramer multiple comparisons test versus control group (# P < 0.05, ### P < 0.001).
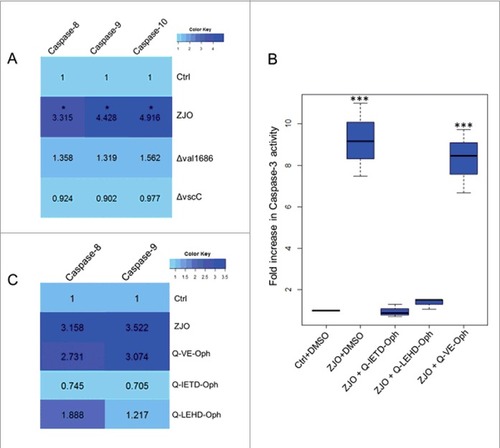
Figure 6. Activated ERK and JNK pathways are involved in V. alginolyticus-induced apoptosis. FHM cells were pre-incubated with 40 μM of ERK inhibitor (U0126-EtOH), 20 μM of p38 MAPK inhibitor (SB203580) and 10 μM of JNK inhibitor (SP600125) as described in the Materials and Methods. Inhibitory effect on V. alginolyticus-induced apoptosis was evaluated using Hoechst33258 staining (A) and caspase-3 activity assay (B). Arrows indicate the fragmented nuclei, while arrowheads indicate condensed nuclei. Scale bar = 50 µm. The data are expressed as fold-increase compared to the corresponding values of caspase activity in uninfected cells (Ctrl) (3 independent experiments). A Kruskal Wallis test followed by a Tukey-Kramer multiple comparisons test versus control group (## P < 0.01).
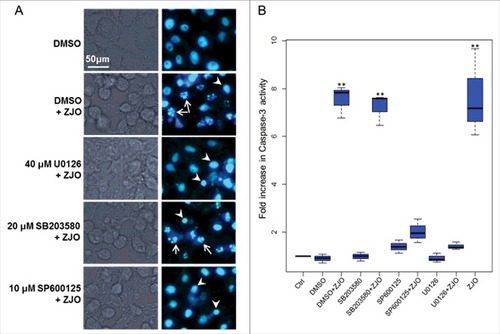
Figure 7. Deletion of val1680 reduced V. alginolyticus T3SS-induced LDH release. FHM cells were either uninfected or infected with V. alginolyticus strains ZJO, Δval1686, Δval1680, Δval1686Δval1680 and ΔvscC as described in the Materials and Methods. At the indicated time points, culture supernatants were measured for the release of LDH and calculated as a percentage of total cellular lysis. The data are expressed as means ± SEM from three independent experiments.