Figures & data
Figure 1. Schematic representation of the D-alanine metabolic pathway in bacteria. The primary route of D-alanine biosynthesis in bacteria is via the reversible interconversion from L-alanine to D-alanine, a reaction catalyzed by alanine racemase (Alr; EC 5.1.1.1). Several Gram-positive bacteria can also favor the synthesis of D-alanine by using the D-amino acid transaminase (Dat; EC 2.6.1.21) to catalyze the interconversion reaction of D-alanine and 2-oxoglutarate to pyruvate and D-glutamate. D-alanine is incorporated into peptidoglycan as a D-alanyl–D-alanine dipeptide, where it is involved in cross-linking of adjacent peptidoglycan strands. In S. aureus and many other Gram-positive bacteria, D-alanine esters decorate the teichoic and lipoteichoic acids of the cell wall.
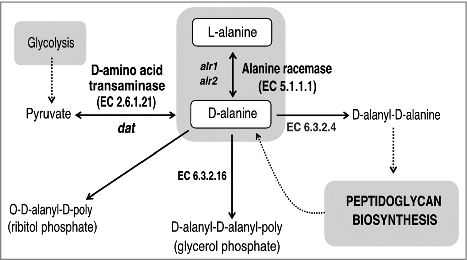
Figure 2. Confirmation by PCR of Δalr1 and/or Δalr2 gene deletions in S. aureus 132 derivatives. A. Map of the alr1 gene of S. aureus 132 and primers used to detect the Δalr1 deletion. B. Map of the alr2 gene of S. aureus 132 and primers used to detect the Δalr2 deletion. C. Primers alr1EXT-F and alr1EXT-R were used to generate a 1,600 bp fragment (alr1-EXT) from strains carrying the wild type alr1 allele or a 451 pb fragment from strains carrying the mutant Δalr1 allele. Primers alr1-F and alr1-R were used to generate an inner fragment of the alr1 gene (alr1-INT) of 491 bp only from strains carrying the wild type alr1 allele. D. Primer alr2EXT-F and alr2EXT-R were used to generate a 1,521 bp fragment (alr2-EXT) from strains carrying the wild type alr2 allele or a 469 bp fragment from strains carrying the mutant Δalr2 allele. Primers alr2-F and alr2-R were used to amplify an inner fragment of the alr2 gene (alr2-INT) with 519 bp only from strains carrying the wild type alr2 allele. M, DNA ladder in bp.
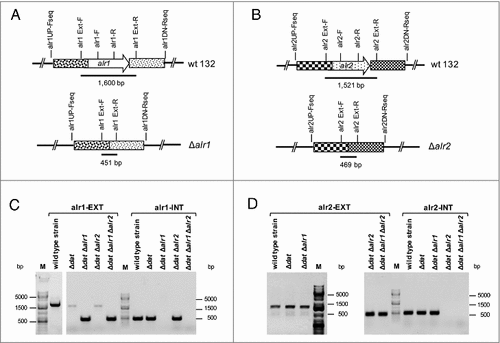
Figure 3. Growth and survival kinetics from S. aureus 132 Δdat Δalr1 Δalr2. Cells grown in overnight cultures in TSB supplemented with D-alanine were pelleted, washed, and resuspended in fresh medium in the presence or absence of 5 mM D-alanine. A. Growth was monitored by measuring the turbidity (OD at 600 nm) at different times. B. Culture viability (Log10 CFU per milliliter) on TSA containing 5 mM D-alanine after growth with or without D-alanine. S. aureus 132 Δdat Δalr1 Δalr2 shows normal growth in TSB supplemented with 5 mM D-alanine, but it is not able to grow without the exogenous supply of this compound. In contrast, the isogenic parental strain grows as per normal in TSB either with or without D-alanine. Squares and circles represent the wild type strain and the triple mutant, respectively in the presence (closed symbols) or the absence (open symbols) of D-alanine.
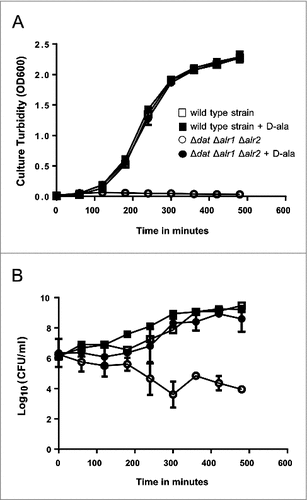
Figure 4. Progressive degeneration of the cell wall and lysis of S. aureus 132 Δdat Δalr1 Δalr2 in the absence of D-alanine. Images were taken with a transmission electron microscope at different magnifications. As control, micrographs of the wild type strain are shown. Black arrows indicate bacteria with an intact cell envelope; dashed arrows indicate cell disruption with loss of intracellular material, projections of the cell wall and release of intracellular content.
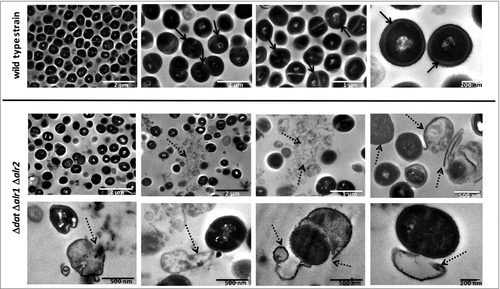
Figure 5. D-alanine auxotrophic strain of S. aureus 132 is attenuated for virulence in mice. A. Survival of BALB/c mice (n = 4/group) inoculated via i.p. route with S. aureus 132 wild type or 132 Δdat Δalr1 Δalr2 strain at different bacterial doses (CFU), as indicated in the legend. B. Blood clearance of D-alanine auxotroph vaccine candidate. Log10 CFU per milliliter of S. aureus 132 (on TSA plates) and 132 Δdat Δalr1 Δalr2 (on TSA containing 5 mM D-alanine) recovered over time from blood of BALB/c mice (n = 4/group) after i.v. and i.p. injection with approximately 2.5 × 10⁷ CFU of these strains. Data are mean ± s.e.m. #P < 0.001, according the Student's t test. C. Bacterial dissemination and abscess formation into the different organs after i.v. or i.p. administration of S. aureus 132 wild type or 132 Δdat Δalr1 Δalr2 strains (6 × 10⁶ CFU and 1.9 × 10⁷ CFU, respectively for i.v. inoculation and 2 × 10⁷ CFU and 4 × 10⁷ CFU, respectively for i.p. inoculation) in BALB/c mice (n = 5–9/group). At 28 days post-infection, bacterial loads in kidney, spleen, lung, liver and heart (only i.p.) were determined, by plating serial dilution on TSA (parental strain) or TSA plates supplemented with 5 mM D-alanine, as Log10 CFU per gram of organ. Each symbol represents an individual mouse, with the horizontal lines showing the mean for each group. P-value, according to log-rank (Mantel-Cox) test is indicated in the figure. Representative images of those organs in each group are shown below the graphics. Arrows indicate some bacterial aggregates and abscess formation into the organs. D. Recovery of S. aureus 132 wild type (on TSA plates) and the triple mutant Δdat Δalr1 Δalr2 (on TSA supplemented with 5 mM D-alanine) strains in the catheter infection model in mouse. The implanted subcutaneous catheter segments in BABL/c mice (n = 4/group) were inoculated with approximately 1.6 × 10⁷ CFU and bacteria adherent to the catheter were quantified one week after infection. Bars represent the mean of Log10 CFU per catheter and the line represent the standard deviation. P-value according the Student's t test is indicated. Representative images of the insertion site (square) and the tissue surrounding the catheter with (arrows) or without infection are shown. E. Percent of body weight change in BALB/c mice (n = 8/group) after two i.p. injections (days 0 and 14, indicated with arrows) of the vaccine candidate S. aureus 132 Δdat Δalr1 Δalr2 strain (approximately 2 × 10⁷ CFU) compared with mice administered saline.
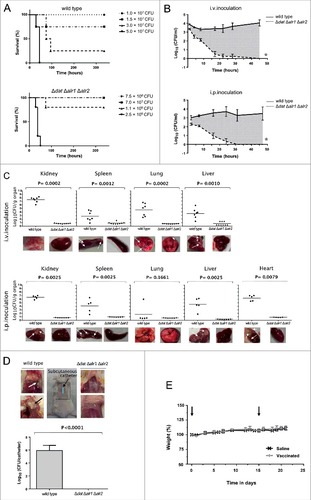
Figure 6. Vaccinated mice are protected against infection with S. aureus 132. A. Survival of BALB/c mice (n = 8/group) immunized via i.p. with S. aureus 132 Δdat Δalr1 Δalr2 (two dose-schedule, approximately 2.5 × 10⁷ CFU) after challenge with a lethal dose of S. aureus 132 (1.2 × 10⁸ CFU per mouse) #P < 0.0001 is significantly different from no vaccination control (Log-rank Mantel-Cox test). B. Percentage weight change relative to starting body weight (preinfection) in BALB/c mice (n = 6/group) after challenge with a sub-lethal dose of S. aureus 132 (2.4 × 10⁷ CFU per mouse) on day 21. Vaccinated and control mice were injected via i.p. with S. aureus 132 Δdat Δalr1 Δalr2 (two dose-schedule, approximately 3 × 10⁷ CFU per mouse) or saline, respectively. C. Bacterial loads in kidney, spleen, liver and lung obtained from vaccinated and control mice 5 days after infection with S. aureus 132. BALB/c mice (n = 7/group) were immunized via i.p. with S. aureus 132 Δdat Δalr1 Δalr2 (two dose-schedule, approximately 3 × 10⁷ CFU per mouse) or saline, and challenged with a sub-lethal dose of S. aureus 132 (2 × 10⁷ CFU per mouse). Each symbol represents an individual mouse, with the horizontal lines showing the mean for each group. P-value, according to log-rank (Mantel-Cox) test is significantly different from no vaccination control in all four organs. Representative images of those organs in each group are shown below the graphics and arrows indicate some bacterial aggregates and small abscess formation into the organs of saline group. D. S. aureus 132 infection in leukopenic mice. BALB/c mice (n = 5/group) untreated or treated with cyclophosphamide (CYP, three doses of 100 mg/kg via i.p. route) in 48-h intervals were inoculated via i.p. route with S. aureus 132 wild type strain at different bacterial doses (CFU), as indicated in the legend, and survival was recorded over 14 days post-infection. E. Vaccine protection of leukopenic mice against S. aureus 132 infection. Vaccinated and control BALB/c mice (n = 8/group) were injected via i.p. with S. aureus 132 Δdat Δalr1 Δalr2 (two dose-schedule, approximately 3 × 10⁷ CFU per mouse) or saline, respectively. Animals were treated with CYP (three doses of 100 mg/kg via i.p. route) in 48-h intervals, one week before challenge by i.p. injection with S. aureus 132 with 7.5 × 10⁴ CFU on day 21 following the first immunization. Survival of mice was recorded over 14 days. #P < 0.005 is significantly different from no vaccination control (Log-rank Mantel-Cox test).
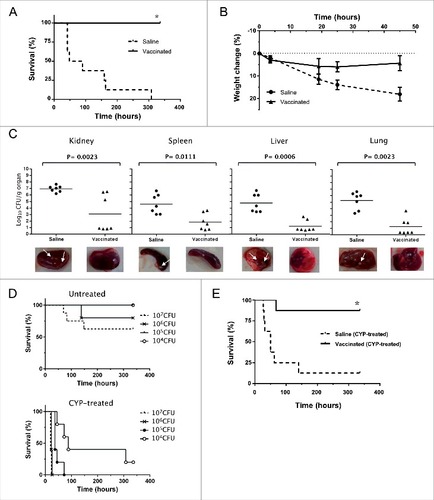
Figure 7. Humoral and cellular immune responses after vaccination. A. Log10 1/Endpoint titer of IgG antibodies produced against the isogenic Δspa strain of S. aureus 132 in BALB/c mice (n = 6) on post vaccination days 7, 14 (after one immunization) and 21 (two immunizations). BALB/c mice were vaccinated with two doses of S. aureus 132 Δdat Δalr1 Δalr2 (2.5 × 10⁷ CFU). The antibody titers were determined by an indirect ELISA. The boxes represent the first and third quartiles; the horizontal line represents the median; the whiskers represent the interquartile range. #P < 0.001 (Mann-Whitney U test), compare with saline group. #P < 0.01, ##P < 0.001, compared with the preceding condition. B. Log10 1/Endpoint titer of total IgG and subclasses (IgG1, IgG2a, IgG2b, IgG3) and IgM antibodies produced against S. aureus 132 Δspa in sera of BALB/c mice vaccinated with two doses of S. aureus 132 Δdat Δalr1 Δalr2 (3 × 10⁷ CFU). Sera was obtained seven days after the first and second immunizations (days 7 and 21, respectively). #P < 0.005 (Mann-Whitney U test), compared with saline group. #P < 0.05, compared with the day 7. C. Vaccination with S. aureus D-alanine auxotrophic strain triggers IL-17A cytokine-secreting T-cells. BALB/c mice (n = 7/group) were immunized twice (days 0 and 14) with S. aureus 132 Δdat Δalr1 Δalr2 (5 × 10⁷ CFU per mouse) or administered saline. At day 54 after the second immunization, splenocytes were isolated and ex-vivo restimulated (5 × 10⁶ cells per well) with the vaccine strain (5 × 10⁷ CFU per well) for 48 h. As positive control, mouse splenocytes were cultured with 1X Cell Stimulation Cocktail. The symbols represent the result for each individual animal, and the horizontal line represents the median. There was a significant difference (#P = 0.0023, Mann-Whitney U test) in the concentration of IL-17A in splenocyte supernatants of vaccinated mice compared to that of naïve mice. D. Passive antisera transfer from immunized mice protects against S. aureus acute lethal infection in naïve mice. BALB/c mice (n = 6/group) were administered with antisera (immune or naïve serum) 3.5 h before challenge with S. aureus 132 (6 × 10⁷ CFU). Survival was monitored daily for 14 days. #P = 0.0008, according to log-rank (Mantel-Cox) test.
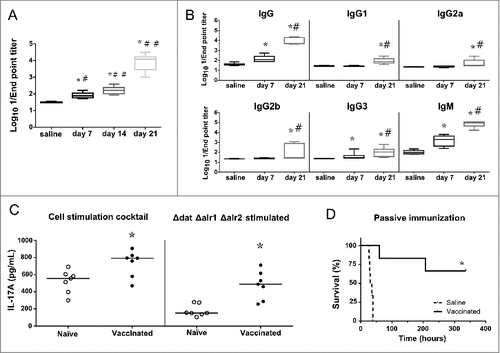
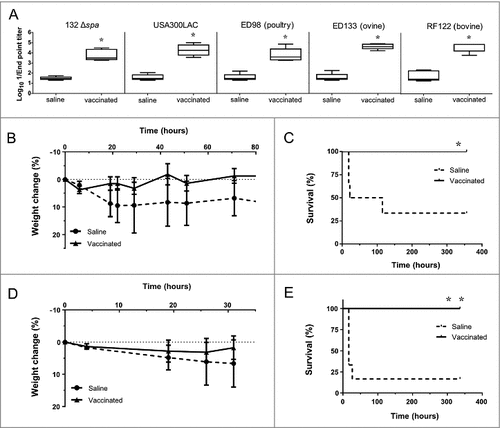
Figure 8. Immunization with D-alanine auxotrophic vaccine elicits cross reactive antibodies and protects against staphylococcal infections. A. Cross reactive IgG antibody titers induced after vaccination against different staphylococcal strains: S. aureus 132 Δspa, USA300 LAC, ED98 (from poultry), ED133 (ovine origin) and RF122 (bovine origin). Serum was obtained from BALB/c mice (n = 5) two weeks after vaccination with two doses of S. aureus 132 Δdat Δalr1 Δalr2 (about 1.7 × 10⁸ CFU). The boxes represent the first and third quartiles; the horizontal line represents the median; the whiskers represent the interquartile range. #P < 0.05 (Mann-Whitney U test,) compared with saline group. B-E. Mice survival (C and E) and percentage of body weight loss (B and D) after vaccination with S. aureus 132 Δdat Δalr1 Δalr2 (two dose-schedule, approximatively 3 × 10⁷ CFU) or saline administration (n = 6/group), and challenge with a lethal dose of USA300 LAC (3 × 10⁷ CFU) (B and C) or RF122 (3.5 × 10⁷ CFU) (D and E). #P < 0.05 and ##P < 0.005 (Log rank Mantel-Cox test), compared with saline group.