Figures & data
Table 1. Oligonucleotide sequences for real-time RT-PCR.
Figure 1. Protective effect of lucidone on DENV-infected ICR mice. The experimental procedure of DENV-infected ICR mice model. Six-day-old ICR suckling mice were divided into three groups, including mice that were intracranially inoculated with DENV (2 × 10⁵ pfu per mouse) with or without lucidone treatment (0.4 or 1 mg/kg) at 2, 4, and 6 days. Mice were intracranially inoculated with 60°C heat-inactive DENV (iDENV) and saline treatment as a negative control. The (A) body weight (B) clinical score (C) survival rate were monitored daily and (D) virus titer was determined on day 7 by plaque assay. Illness symptoms were scored as described in the Materials and Methods section. Each group included more than eight mice. #P versus non-lucidone treated control group.
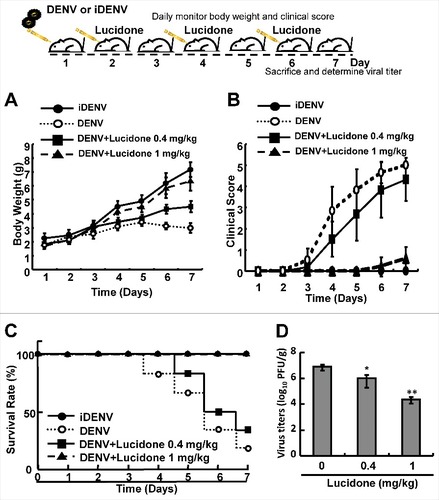
Figure 2. Effect of lucidone on DENV protein expression and RNA replication in DENV-infected cells Lucidone suppressed DENV replication in DENV-infected Huh-7 cells. DENV-infected Huh-7 cells were exposed to lucidone at different concentrations for 3 days. (A) Western blotting was performed using anti-DENV NS2B antibody and anti-GAPDH antibody. GAPDH protein levels showed equal loading of cell lysates. (B) Total RNA of lucidone-treated cells was extracted to quantify DENV RNA levels by qRT-PCR. Relative DENV RNA levels were normalized by cellular gapdh mRNA. (C) Cellular toxicity was simultaneously evaluated by the MTS assay. “0” indicates treatment with 0.1% DMSO. DENV RNA levels and cell viability were presented as percentage changes compared to those in lucidone-untreated DENV-infected cells, in which the relative RNA level was presented as 100%. Results are expressed as means ± SD (error bar) of three independent experiments. #P versus non-lucidone treated control group.
Figure 3. Involvement of the induction of HO-1 expression in the inhibitory effect of lucidone on DENV replication. Lucidone activated DENV-reduced HO-1 expression in DENV-infected Huh-7 cells. (A) Lucidone induced HO-1 promoter activity. Huh-7 cells were co-transfected with the HO-1 promoter reporter vector pHO-1-Luc and pSEAP reporter vector, an internal control. The transfected cells were infected with DENV and treated with lucidone for 3 days, and total cell lysates were analyzed for luciferase activity followed by normalization of SEAP activities. (B, C) Lucidone induced HO-1 expression in DENV-infected cells. Total RNA and cell lysates of Huh-7 and DENV-infected Huh-7 cells with or without lucidone treatment were extracted to analyze HO-1 expression by qRT-PCR and western blotting. Relative HO-1 RNA levels were normalized by cellular gapdh mRNA. Western blotting was performed using anti-HO-1 and anti-GAPDH antibodies. The‘0’ indicates treatment with 0.1% DMSO. HO-1 RNA levels were presented as percentage changes compared to parental Huh-7 cells, in which level was presented as 1. Results are expressed as means ± SD (error bar) for three independent experiments. #P versus non-lucidone treated control group; #P versus DENV-infected control group.
Figure 4. Attenuation of anti-DENV activity of lucidone by inhibition of HO-1 expression and activity. (A, B) Silencing HO-1 expression attenuated the antiviral activity of lucidone. DENV-infected Huh-7 cells were transfected with different amounts of HO-1-specific shRNA (0.25–2 μg) or nonspecific shRNA, and then treated with or without lucidone (40 μM) for 3 days. (C, D) HO-1 inhibitor attenuated the antiviral activity of lucidone. DENV—infected Huh-7 cells were treated with different concentrations of SnPP (0–20 μM) with or without lucidone (40 μM) for 3 days. Protein synthesis and RNA replication were analyzed by western blotting and qRT-PCR, respectively. Western blotting was performed using anti-DENV NS2B antibody, anti-HO-1, and anti-GAPDH antibody. GAPDH protein levels showed equal loading of cell lysates. Total cellular RNA was extracted and analyzed by qRT-PCR. The DENV RNA level was normalized by cellular gapdh mRNA. “0” indicates treatment with 0.1% DMSO. DENV RNA levels were presented as percentage changes compared to those in parental Huh-7 cells, in which the level was presented as 1. Results are expressed as mean ± SD (error bar) of three independent experiments. #P versus non-SnPP treated or non-specific shRNA transfected control group; #P versus lucidone alone treated control group.
Figure 5. Reduction of DENV protease activity by lucidone. (A) Schematic diagram of the protease reporter vector with DENV NS2B/3 cleavage siteΔ4B/5 (TTSTRR-GTGNIG) between enhanced green fluorescent protein (EGFP) and secretory nano luciferase (pEG(Δ4B/5)sNLuc). (B) Lucidone suppressed DENV protease activity but attenuated with SnPP treatment. Huh-7 cells were co-transfected with pEG(Δ4B/5)sNLuc and NS2B/3 expression vector pNS2B(G4SG4)NS3. Subsequently, the transfected cells were treated with the indicated concentrations of lucidone in the presence or absence of 20 μM SnPP. After 3 days, the medium and total cell lysates were analyzed for luciferase activity. “0” indicates treatment with 0.1% DMSO. In each transfection experiment, transfection of firefly luciferase expression vector pCMVLuc served as the transfection control to normalize the nano luciferase activity. The relative DENV protease activity was presented as fold changes relative to that in lucidone-untreated cells, which is defined as 1. Results are expressed as mean ± SD (error bar) of three independent experiments. #P versus non-lucidone treated control group; #P versus equal concentration lucidone without SnPP treated group; aP versus SnPP alone treated group.
Figure 6. Effect of induction of IFN response by lucidone on the inhibitory effect of DENV replication. Lucidone induced antiviral IFN responses but attenuated with SnPP treatment. (A) DENV-infected Huh-7 cells were transiently transfected with the IFN response reporter vector, pISRE-Luc. Subsequently, the transfected cells were treated with the indicated concentrations of lucidone in the presence or absence of 20 μM SnPP for 3 days, and total cell lysates were analyzed for luciferase activity. (B, C) Total RNA of lucidone-treated cells in the presence or absence of 20μM SnPP was extracted to quantify IFN-2 and IFN-17 levels by qRT-PCR. (D–G) Total RNA of lucidone-treated cells in the presence or absence of 20μM SnPP was extracted to quantify OAS1, OAS2, OAS3, and PKR RNA levels by qRT-PCR. (H-M) 0.1g of brain tissue of DENV-infected ICR suckling mice was collected and the total RNA was extracted to quantify IFN-2, IFN-5, OAS1, OAS2, OAS3 and PKR levels by qRT-PCR. Relative RNA levels were normalized by cellular gapdh mRNA levels. “0” indicates treatment with 0.1% DMSO. The RNA levels were presented as fold changes compared to those in lucidone-untreated cells, in which the level was presented as 1. Results are expressed as mean ± SD (error bar) of three independent experiments. #P versus DENV-infected control group; #P versus equal concentration lucidone without SnPP treated group; aP versus SnPP alone treated group.
Figure 7. Effect of lucidone on the expression of Nrf2 in DENV-infected cells. Lucidone activated Nrf2 expression and the efficacy of nucleus translocation. (A) DENV-infected Huh-7 cells were treated with the indicated concentrations of lucidone. The cell lysate was separately extracted from the cytoplasm and nuclear extracts and analyzed by western blotting using anti-Bach1, anti-keap1, anti-Nrf2, anti-GAPDH, and anti-LaminB1 antibodies. GAPDH and Lamin B protein levels showed equal loading of cell lysates. (B) DENV-infected cells were transfected with reporter plasmid p3xARE-Luc and treated with the indicated concentrations of lucidone for 3 days, and total cell lysates were analyzed for luciferase activity. “0” indicates treatment with 0.1% DMSO. The luciferase activity was presented as fold changes compared to that in lucidone-untreated cells, in which the level was presented as 1. Results are expressed as mean ± SD (error bar) of three independent experiments. #P versus lucidone non-treated control group; #P versus DENV-infected control group.
Figure 8. Restoration of DENV protein synthesis and RNA replication by inhibition of Nrf2 expression in lucidone-treated cells. Silencing Nrf2 expression attenuated the induction of HO-1 and the antiviral activity of lucidone. DENV-infected cells were transfected with different amounts (0–2 µg) of Nrf2-specific shRNA and treated with or without 40 µM lucidone for the detection of (A) DENV protein synthesis and (B) DENV RNA replication after incubation for 3 days. Western blotting was performed using anti-DENV NS2B, anti-Nrf2, anti-HO-1, and anti-GAPDH antibodies. GAPDH protein levels showed equal loading of cell lysates. Total cellular RNA was extracted and analyzed by qRT-PCR. The ratio of DENV RNA level was normalized by cellular gapdh mRNA level. “0” indicates treatment with 0.1% DMSO. The RNA levels were presented as percentage changes compared to those in lucidone-untreated cells, in which the level was presented as 100%. Results are expressed as mean ± SD (error bar) of three independent experiments. #P versus non-specific shRNA transfected control group; #P versus DENV-infected control group.
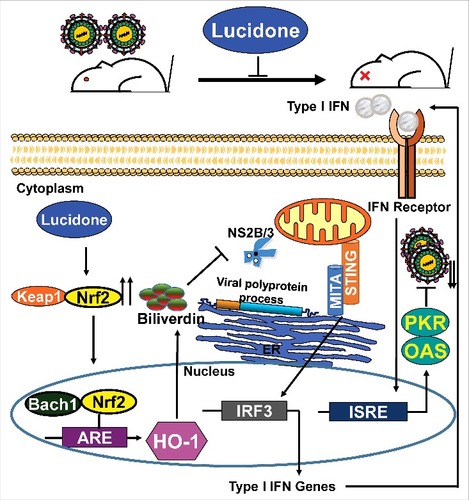
Figure 9. Model of action of lucidone against DENV replication Lucidone induces Nrf2-mediated HO-1 signaling pathway against DENV replication through the inhibition of NS2B/3 protease activity and the induction of antiviral IFN response, ultimately extending the life-span of DENV-infected mice.